
At its heart, Product Analytics allows organizations to become more customer-centric. A key part of the modern data ecosystem, it provides teams with the insights they need, by making customer and product data more accessible, digestible, and powerful.
And despite the name, it’s used by teams throughout the organization—from marketing and sales to data teams and, yes, product teams.
In this guide, we cover everything you need to know about the power of Product Analytics and how to put your data to work for you and your customers.
What is Product Analytics?
Product Analytics enables teams to develop a holistic, well-rounded understanding of how users engage with their digital products and experiences.
It encompasses a set of tools, metrics, and analyses that help companies:
- Build the products that people want and do it quickly—meaning more revenue in less time
- Increase conversion rate for faster growth and more revenue, at a lower cost
- Ensures product teams can reduce churn, increasing retention and lifetime value, leading to more revenue and MRR protection for the long term
Companies large and small need to harness the power of their data. Either you turn data into growth or your competitors will. That’s why Product Analytics is so important for modern organizations—because it enables everyone in the company to turn data into decisions that improve the product, put customers first, and grow the business.
Product Analytics as Part of the Modern Data Stack
Product Analytics isn’t new, so why are we talking about it right now?
The data ecosystem is undergoing a huge evolution, and that’s changed the Product Analytics space.
Every company, big and small, can afford its own cloud data warehouse. Insights and capabilities that used to require prohibitively expensive tech and expertise to access are quickly and readily available today.
The cloud data warehouse (CDW) has become the gravity well, a central source of truth for all of your data.
That’s led to the modern data stack—a boom in tools and solutions built to connect directly to the CDW, harnessing that data and turning it into insights everyone across the organization can easily access to make quicker smarter decisions.
The modern data stack is a new wave washing over the Product Analytics space. Today’s best-in-class solutions are all about connecting directly to the data warehouse. That direct connection means:
- Companies can maintain ownership and control over their data
- Product Analytics platforms can become self-serve and extremely easy to set up
- Users can quickly and easily pull clear analyses out of complex customer behaviors
- Data is democratized—everyone in the organization can access customer data without SQL or coding expertise
When we talk about Product Analytics today, those are the kind of tools we’re talking about.
Google Analytics vs. Product Analytics
You already have Google Analytics so why do you need Product Analytics?
Product Analytics tools don’t compete with Google Analytics—they build on it. But for those new to the space, it can be hard to get your hands around how these tools differ, where one ends and the other begins.
While Google Analytics is powerful for marketers, the data is limited. It’s designed to help marketers measure and analyze website traffic and performance.
Despite that, many people try to use the tool to answer questions it wasn’t built for and can’t adequately answer. GA can’t tell you:
- Who your best and most engaged customers are
- The steps they take along your customer journey funnel and through your product
- What your most profitable conversion paths look like
That’s where Product Analytics comes into play. You can answer those questions because Product Analytics is designed to help you understand the characteristics and behaviors of the people using your product.
For example: Let’s say you’re a Product Manager building a mobile app. Google Analytics can tell you which acquisition source sends the most visitors to your signup page.
Product Analytics can tell you…
- Which acquisition source is the most profitable
- What retention looks like among customers who came from that source
- How the segment of users who came from that source behave within the product—and how that differs (or doesn’t) from other customer segments
- The lifetime value (LTV / CLTV) of those customers versus those who came from other acquisition sources
Business Intelligence (BI) vs. Product Analytics
Business Intelligence (BI) tools are another category often linked with Product Analytics. Here’s the big difference: BI tools aren’t built for cross-functional, everyday use and decision-making.
That’s largely because BI tools run on SQL queries. They aren’t as accessible as Product Analytics because teams need to either know how to write SQL code or use technical resources to do it for them. That widens the time gap between data and decisions and adds a ton of burden to the data teams’ plate.
Plus, SQL is the language of machines—not people.
Let’s say you want to know how many people downloaded your app by analyzing UTM parameters on a link in your most recent blog post. That’s a straightforward question that SQL, and most BI tools, can answer.
But what if you want to know how many people downloaded your app via the blog post, used a specific feature after signing up for free, and upgraded to a paid subscription a week later? Questions like that are time-consuming, complicated, and sometimes impossible to answer using SQL.
That’s where Product Analytics is better suited to answer—it allows you to answer more in-depth questions, in an interactive way, without using SQL.
That means everyone in the org can:
- Run analyses using a simple, easy-to-use interface
- Ask and answer more complicated business questions, without learning SQL or waiting around for overburdened data analysts to run queries for them
- Get more curious—asking natural, human questions without having to translate them into code
Legacy Product Analytics vs. Modern Product Analytics
The future of data will see every company owning and controlling their own data, but tools like Amplitude, Heap, and Mixpanel aren’t built for that future.
That creates a few problems for modern teams:
- You don’t have complete control or ownership over the copied data
- Your Product Analytics is based on duplicate data
- You have to add and pay for additional tools in your stack in order to successfully integrate
Instead of connecting to your data warehouse in real-time, legacy Product Analytics tools make you duplicate your data using an SDK or API and store it on your behalf creating a second source of truth for your data.
Most require you to use their SDK to pull data into their systems, and that means they own your data.
Some legacy tools require you to add additional tools to your stack, too. Mixpanel, for example, requires teams to use an ETL/ELT tool to send data via Mixpanel’s API.
Plus, different setups and implementation across those tools can cause mismatched event counts.
Here’s the bottom line: pulling data directly from your cloud data warehouse in real-time is more accurate—avoiding data duplication and mismatched event counts—and gives you complete control over your data.
Modern Product Analytics solutions (like Indicative) are able to work within the modern data stack to simplify workflows, ensure direct access to your company’s single source of truth, and enable you to 100% own control of your data.
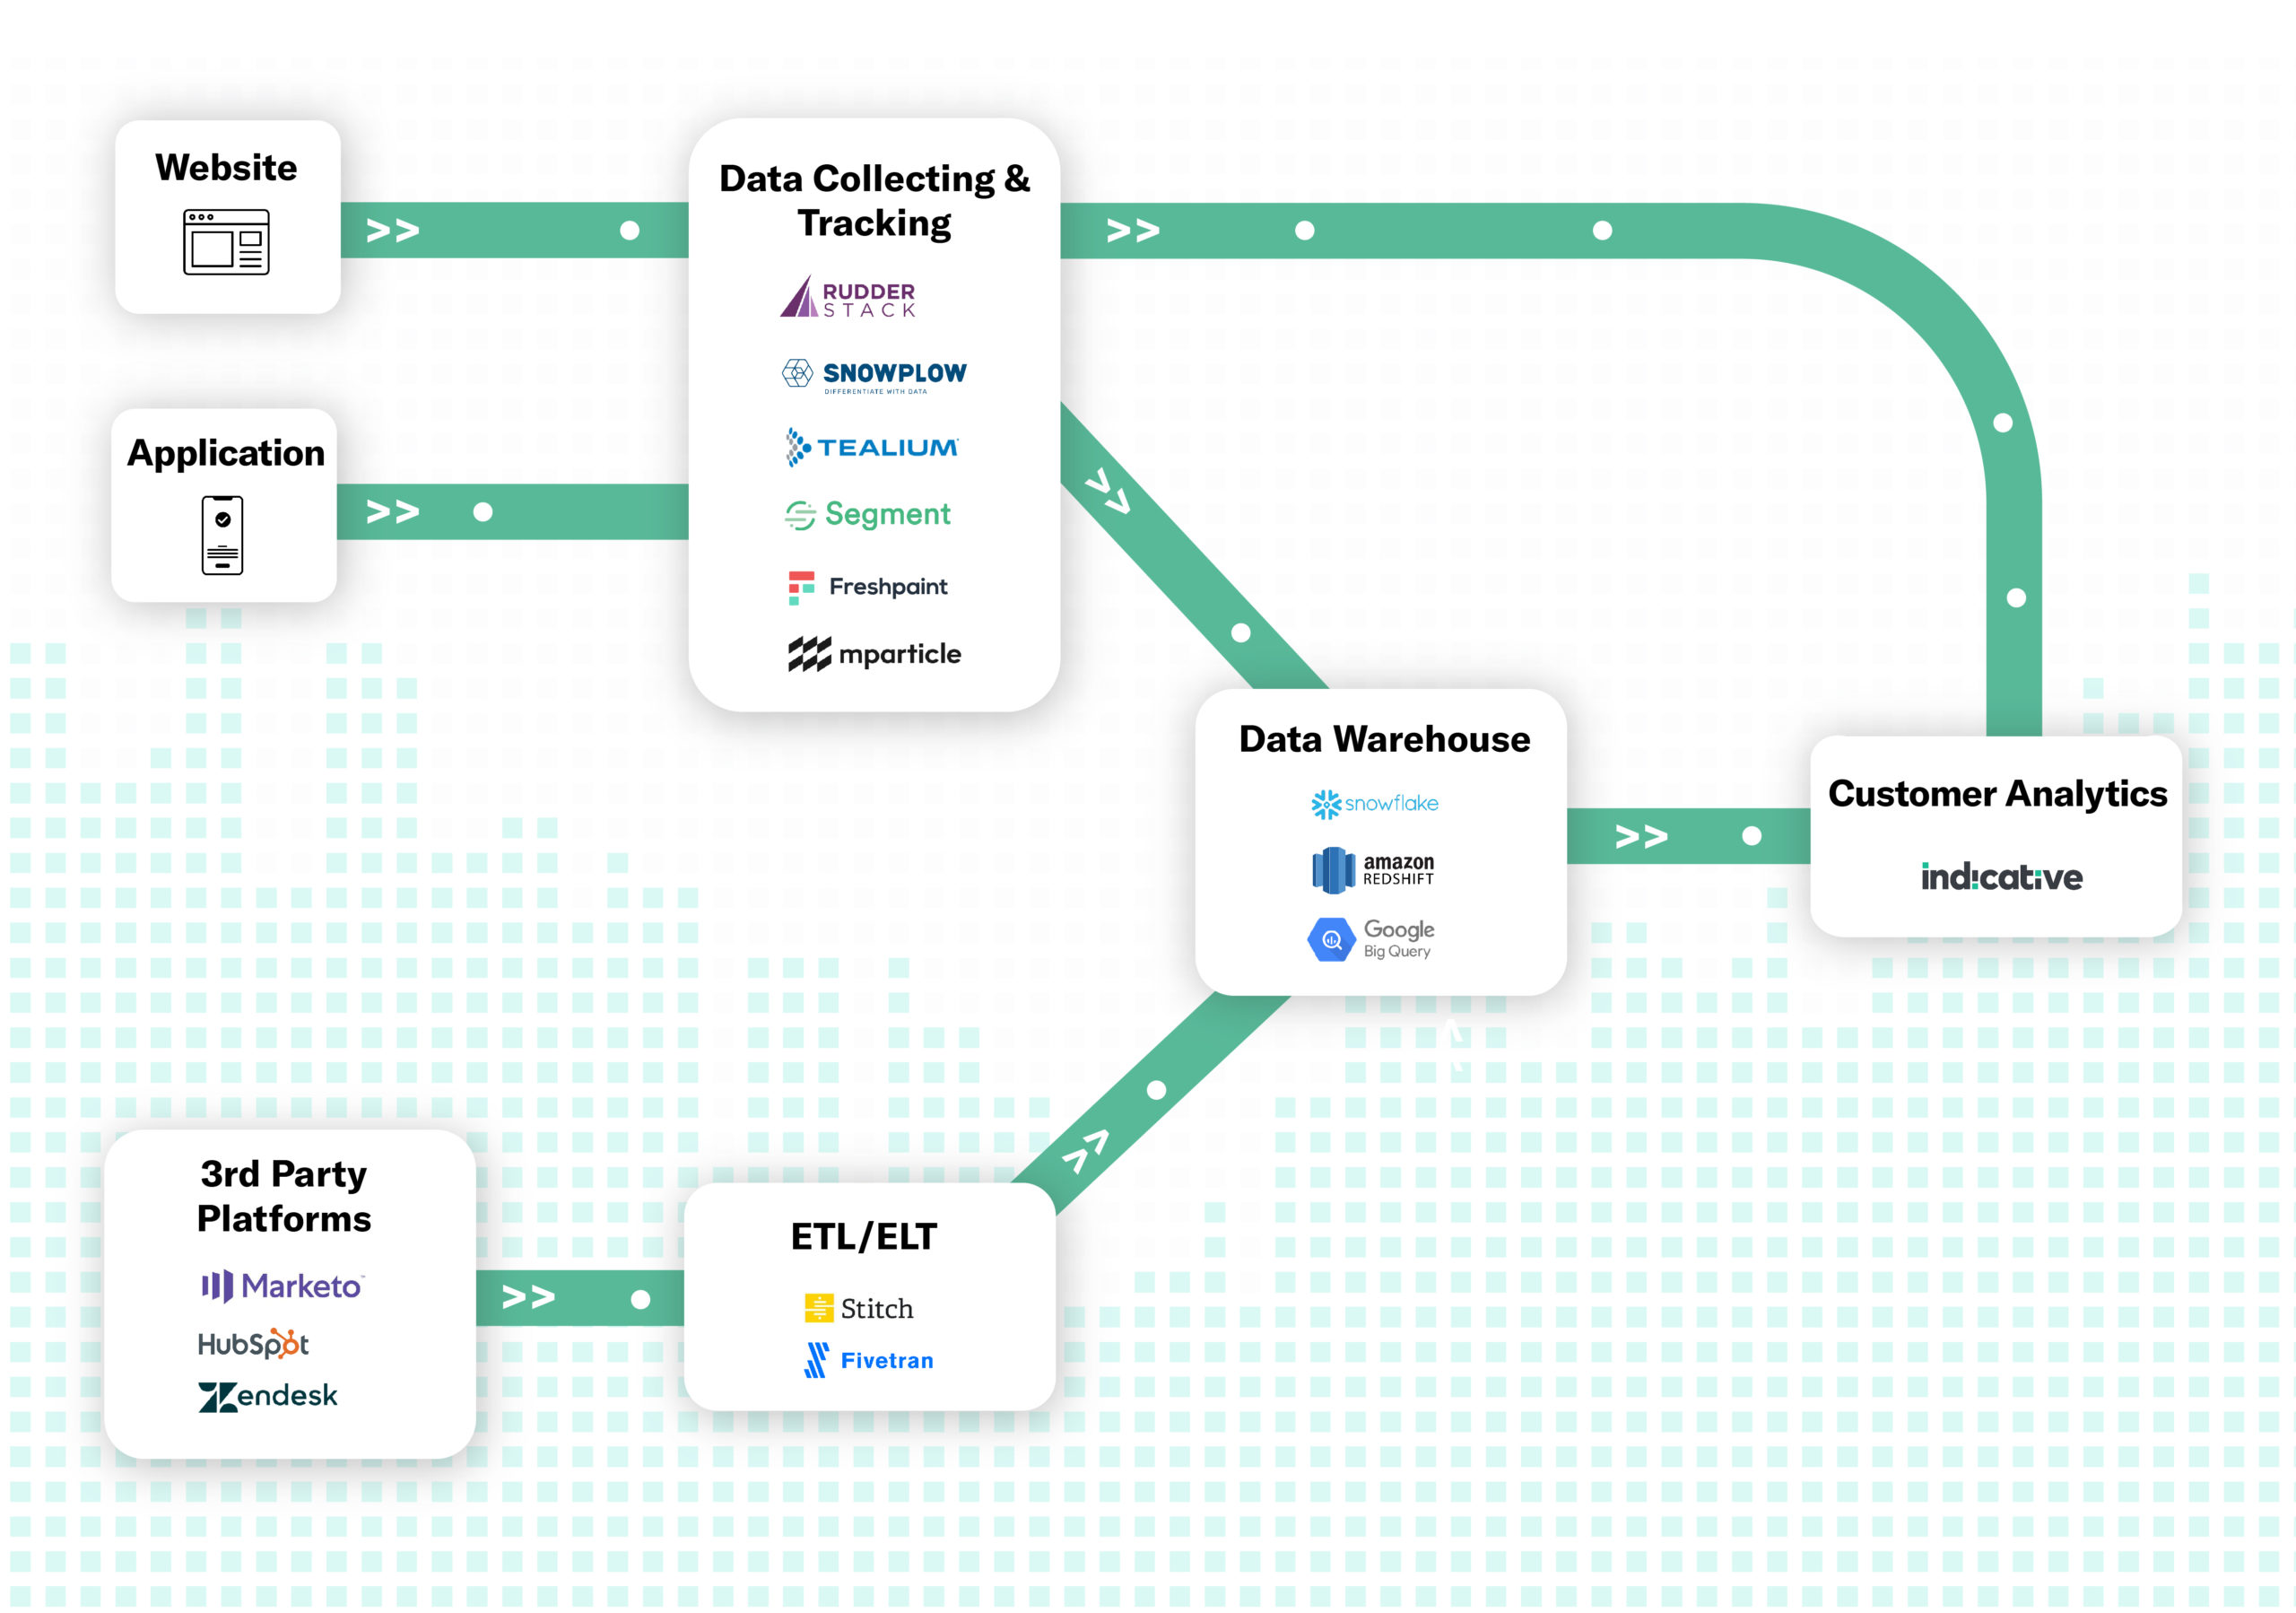
Chart: How data flows into product analytics in the modern data stack
How Is Product Analytics Used Across the Org?
Growing a product isn’t just about the Product Manager or the engineering team. Building better products takes a village. It’s a cross-functional, organization-wide effort. That’s why, despite the name, Product Analytics is used by teams across the entire organization—from marketing to engineering to product teams.
Let’s look at how each can use Product Analytics to simplify analysis and make smart, data-led decisions quickly.
How Product Teams Use Product Analytics
We’ll start with the obvious team: product.
Product Managers use Product Analytics to power product-led growth. It helps them build informed product roadmaps, boost engagement, improve the overall customer experience, and build the features that encourage both short-term adoption and long-term retention.
With Product Analytics, PMs can do things like:
- See how many people who perform a search on the website end up converting
- Understand how feature usage varies between free and paid users
- Visualize how the customer journey varies based on the marketing source or campaign a user came from
- Find out what makes customers upgrade, downgrade, or otherwise change their plan
- Measure the impact of a demo on conversion
- Uncover how user behavior changes across different customer personas
Let’s say you’re launching a redesign of your mobile app’s dashboard and you want to test a soft launch on a smaller group of customers before rolling out the update to the whole user base.
The product team can use Product Analytics to identify a highly engaged segment of customers for your beta.
Once you launch to that segment, you can use cohort analysis to monitor changes in the behavior of those customers. Do they use the app more or less frequently? Does their usage of individual features change? Do they contact support more often? Do they churn? Or upgrade?
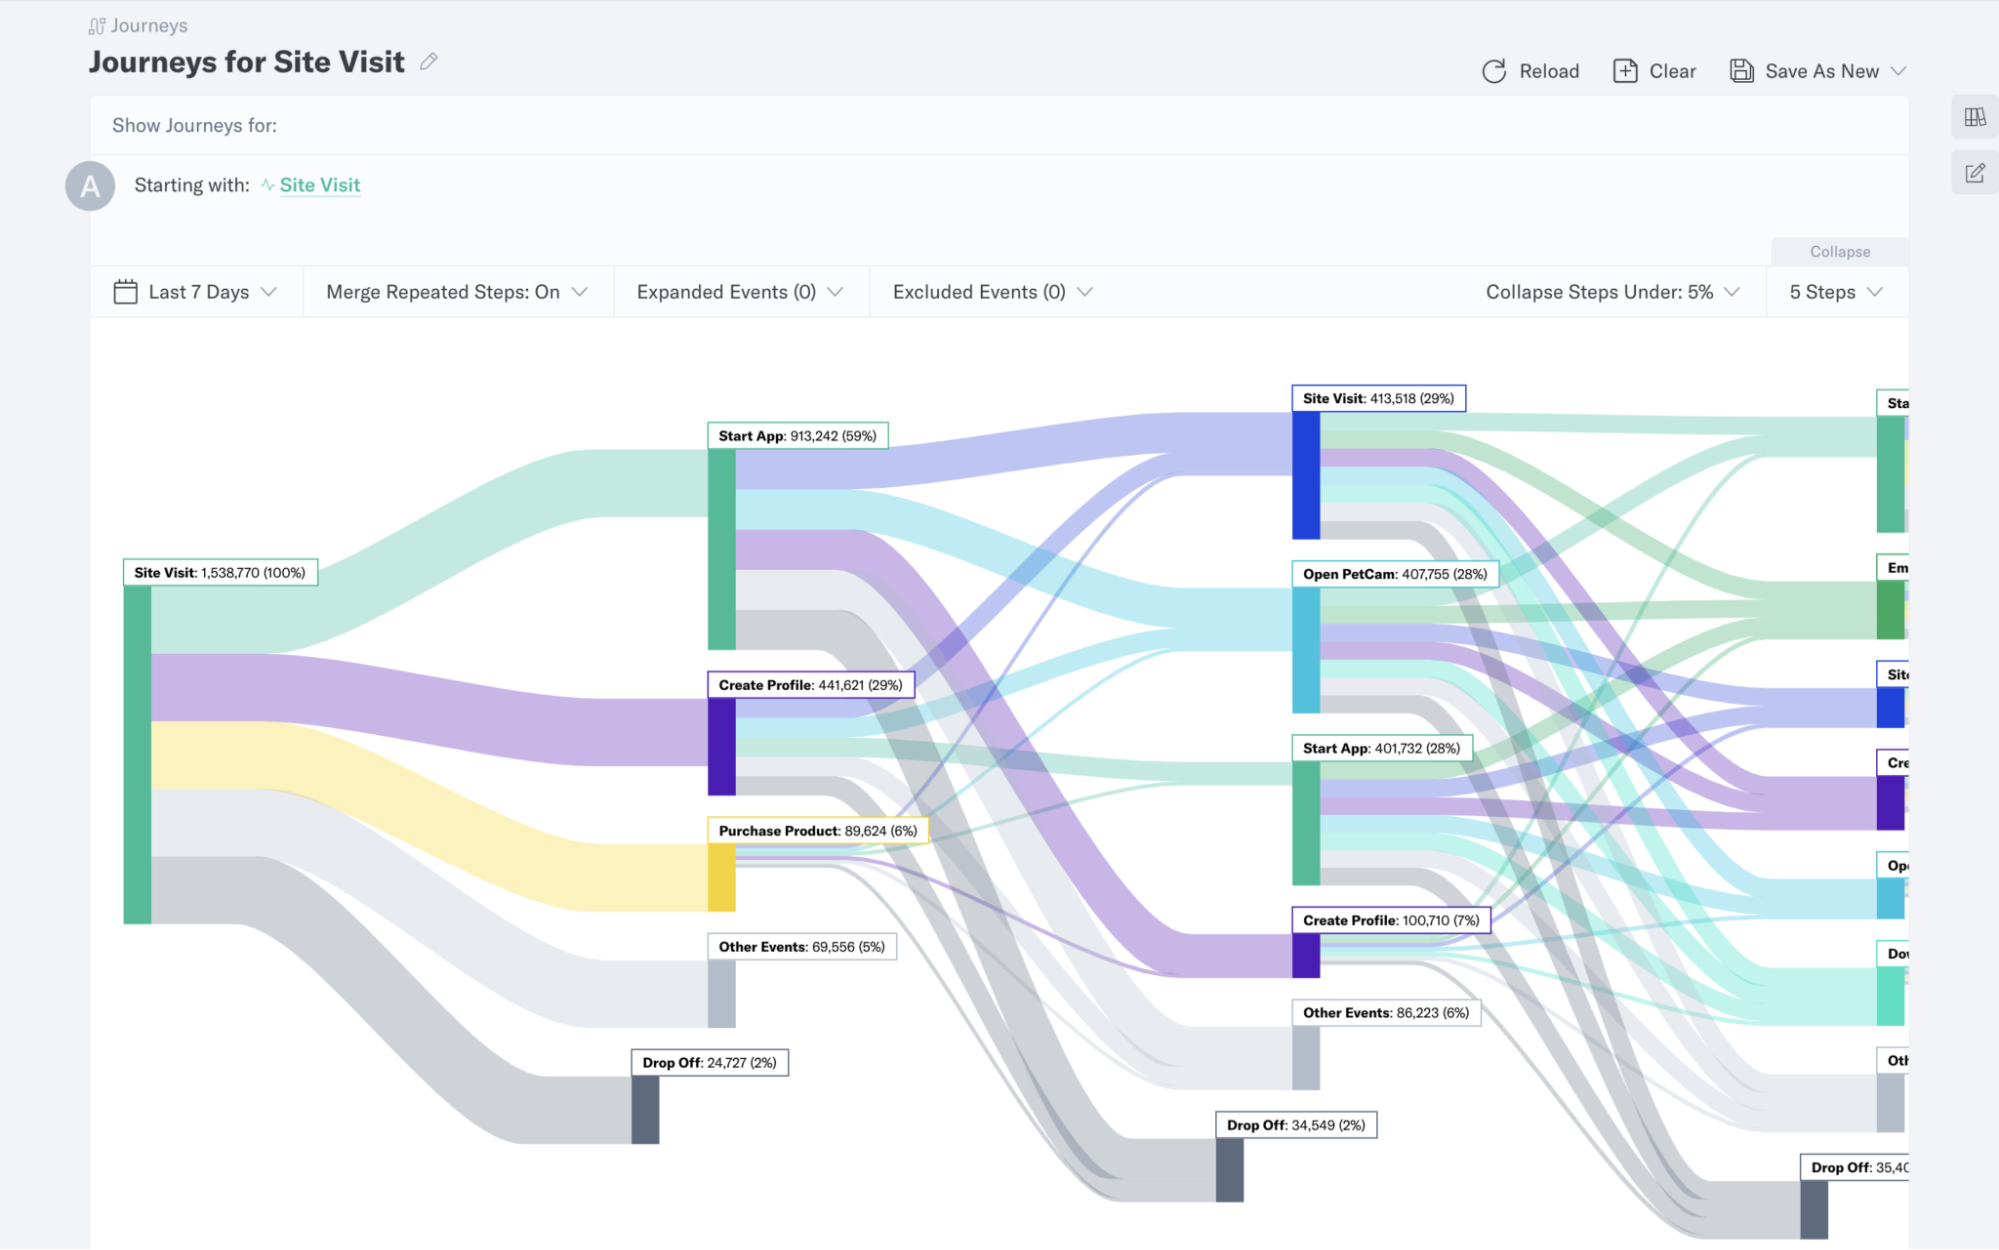
Here’s another example: PetBox—a fictional eCommerce company that sells monthly subscription boxes containing feline products—wants to understand where their users go after opening the app.
Using the Journeys tool in Indicative, they can see the most common paths users take after the event “Start App” and find that 19% of users immediately open a feature called PetCam.
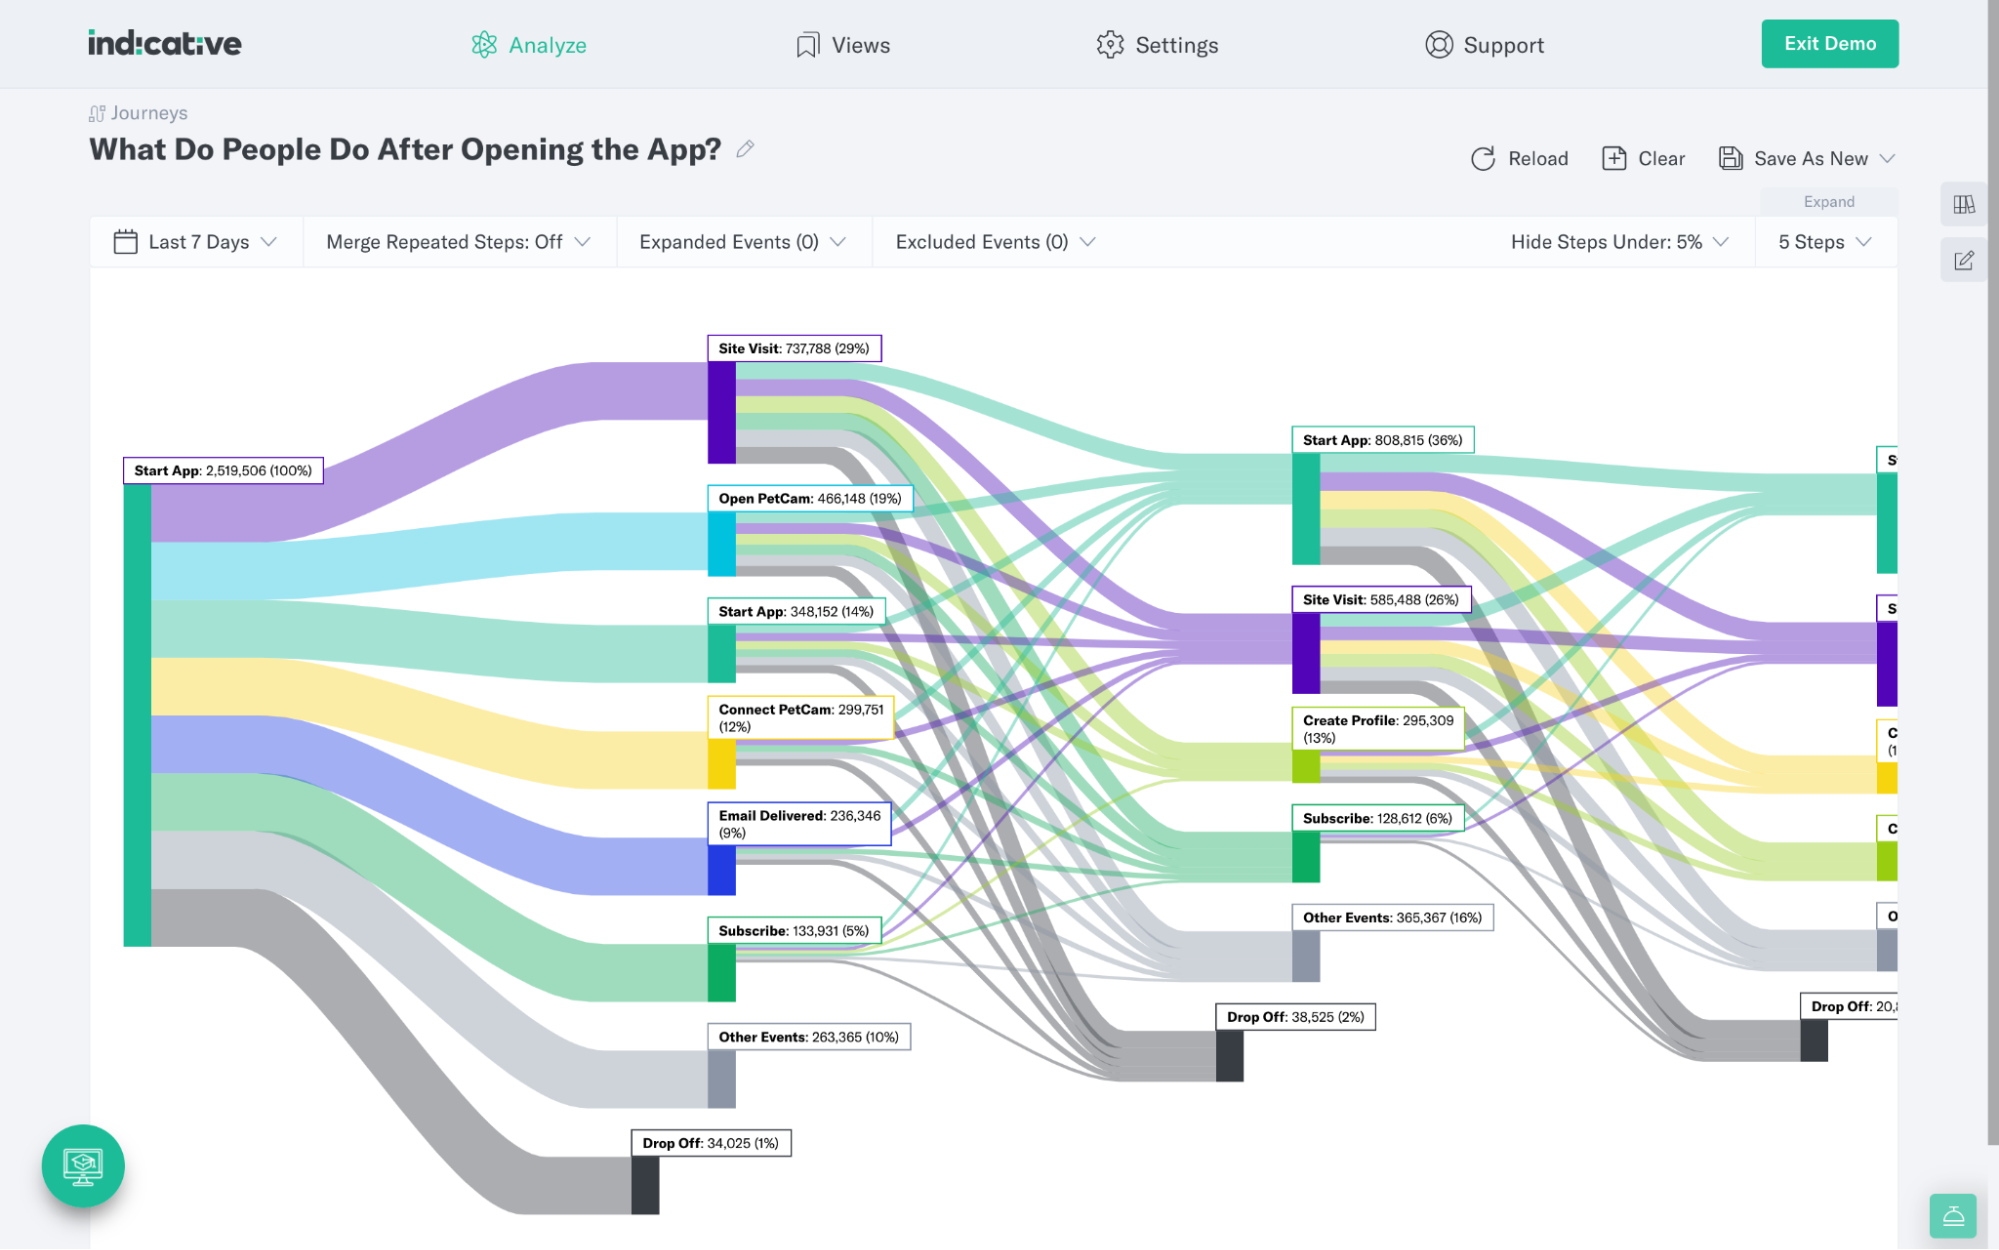
Given the popularity of PetCam, the company may prioritize improvements and additional functionality for the feature.
Read about how BentoBox’s product team monitored the impact of a new feature on conversions and purchase behavior.
How Data Teams Use Product Analytics
Data teams use Product Analytics in a less conventional way: to free up their time.
Without a user-friendly tool that enables other teams to handle their own data needs, Data Analysts are stuck running queries and fielding requests from the rest of the organization.
With Product Analytics implemented, data teams are able to:
- Enable marketing, product, and other teams to run their own queries
- Take the burden off of data analysts
- Free up time to focus on bigger picture data needs
For example: GetYourGuide—a travel company—used Looker and ran ad hoc SQL analyses to help with decision-making. Product Managers and others in the company were completely reliant on Data Analytics to run those queries.
That meant PMs had to wait longer to actually use data to inform product decisions. And it also meant Data Analysts were spending an important part of their time working on tasks that otherwise could have been automated.
With a modern Product Analytics solution, PMs were able to run queries themselves—more quickly and without adding to the data team’s to-do list. Now, Data Analysts can focus on bigger picture tasks, like ensuring the quality and accuracy of the data in their warehouse.
Read about how Indicative empowers GetYourGuide’s data team to focus on the big picture.
How Marketing Teams Use Product Analytics
For marketing teams, success is all about knowing which campaigns, sources, and assets get people to convert.
Marketers need to be able to deeply understand customers, measure acquisition across the entire customer journey, and attribute conversions back to the campaigns and assets that drove them.
With Product Analytics, marketers can:
- Visualize the full-funnel, as it really exists for customers (instead of your ideal funnel)
- See all the paths customers follow to a conversion
- Understand how campaigns and individual assets lead to conversion
- Develop a holistic view of the best customers, so you can tailor campaigns to win more of them
- Measure the value of each marketing channel based on actual CAC and CLTV
- Get a full picture of the customer journey, including offline and online activities
Let’s say you’re running a bunch of campaigns across different channels, and you want to find out which of your efforts lead to your best customers. You can create a cohort of your most profitable customers—based on LTV, for example—to analyze.
Then, you can find the top paths that cohort took toward conversion in the Journeys tool to see which marketing channels and campaigns impacted their journey. That makes it easy to identify and double down on your most effective channels.
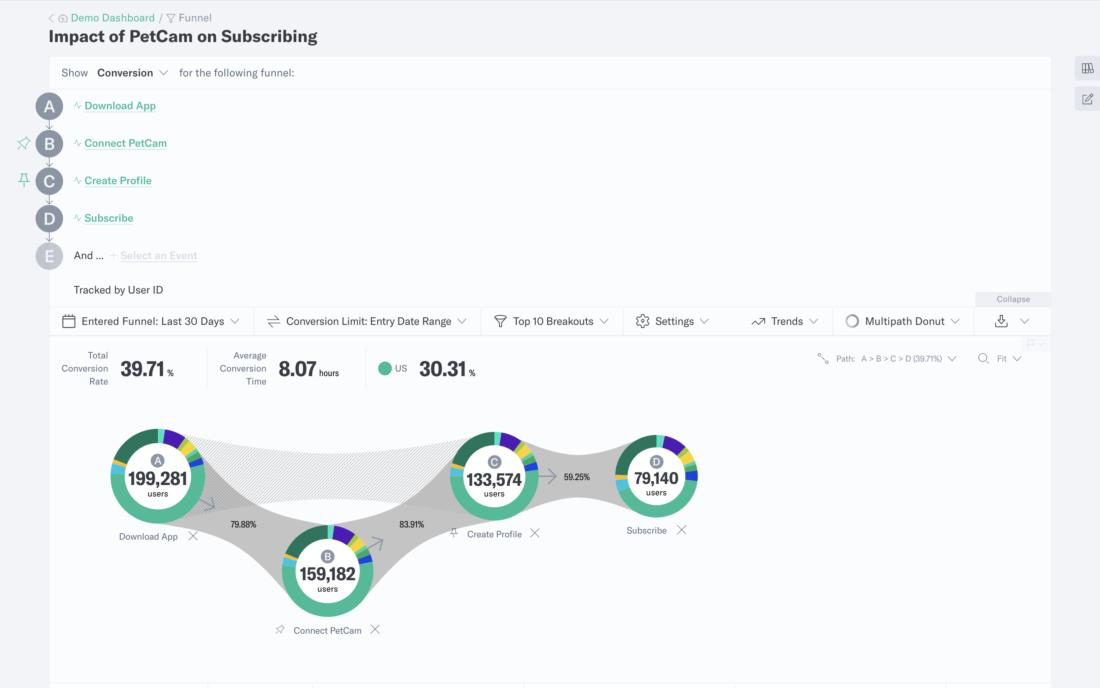
Here’s another example: Let’s say your team is tasked with upgrading more of your free users to paid subscriptions. To do so, you want to understand the paths existing paid users took before they converted to paid.
Using the Multipath Funnel tool, you can view multiple funnels at once.
By analyzing the conversion rate across multiple paths and even steps within a given path, you can find the optimal path for converting free users to paid.
See how Haven Life finds their most profitable marketing campaigns.
What Can You Measure With a Product Analytics Tool?
We know that Product Analytics solutions offer more in-depth data than tools like Google Analytics, and they make it more flexible and accessible than BI tools. Now, we’ll dig into what you can measure with Product Analytics.
Product Analytics solutions are flexible, which means the metrics you focus on depend only on the goals you’re trying to achieve, based on your business strategy.
When you’re focused on growth—financial or otherwise—Product Analytics can help you measure all your Pirate metrics (AARRR):
- Acquisition
- Activation
- Retention
- Referral
- Revenue
You can dig into each of these metrics and get more granular using Product Analytics, too. For example: you can track customer acquisition cost (CAC) and customer lifetime value (CLTV), then compare the two to find your most profitable customers.
Here are 2 vital product KPIs every PM should be tracking:
Customer Retention Rate (CRR)
Your retention rate represents the percentage of customers who stick around for a set period of time. Tracking your CRR is key for making financial projections, building a product that encourages retention, and monitoring the overall health of the business. It’s the flipside of churn—and it’s particularly important for SaaS products.
If your marketing and sales teams are bringing in tons of new customers but only 50% of them stick around for more than a month, for example, that may indicate issues with the product.
The key is to have a set goal for your CRR that enables the company to grow both revenue and your user base.
With Product Analytics, you can dig into your customer retention rate even further—by creating high- and low-retention segments and exploring how their behavior within the product varies, for example.
Engagement
Engagement—measuring how frequently customers use your product—is a great indicator of how valuable they find it. And monitoring engagement metrics can help ensure you’re delivering a product users love and will continue to use and pay for.
Engagement metrics also open up the door to a wealth of further analysis that can help you identify and prioritize new features, product improvements, and more.
For example, you can use Cohort Analysis to identify your most engaged users—then dig into the features they use and other behavior they exhibit. Understanding how highly-engaged users interact with the product can offer ideas for how to encourage higher engagement among other users.
You can also look at the inverse—users whose engagement has dropped off—to understand the reason behind low engagement and how you may be able to combat drop-off.
How Do Product Analytics Tools Measure Those Metrics?
Product Analytics enables you to measure all that by pulling event and user data from your data warehouse into an interface that’s user-friendly, interactive, and makes quick work of modeling the data.
That interface enables everyone in the org to quickly and easily perform different types of analyses to get a holistic picture of product performance and user behavior.
Here, we’ll cover 4 types of analysis you can perform with Product Analytics:
- Cohort analysis
- Segmentation analysis
- Funnel analysis
- Conversion analysis
Cohort Analysis
Cohort analysis is the process of analyzing certain groups of customers (called cohorts) who share a certain set of characteristics or experiences.
Each group of customers within an A/B test, for example, can be tracked and measured as a cohort. Launch cohorts—the group of customers who gain early access to new features and product launches—are another common example of a cohort.
With Product Analytics, you can build behavioral cohorts to help pinpoint the features and campaigns that most effectively engage and retain customers.
You can use cohort analysis to:
- Analyze trial conversions and find ways to speed up trial-to-paid
- Monitor launch cohorts to mitigate churn
- Find the most effective channels for acquisition (based on conversions, CLTV, and more)
- Understand usage patterns for your most engaged customers, so you can nudge more customers into that cohort
If you use Indicative for Product Analytics, here are a few cohorts you can build:
- Select Recurring Behavior to determine the behavioral characteristics that drive customer retention
- Select First-Time Behavior to optimize onboarding
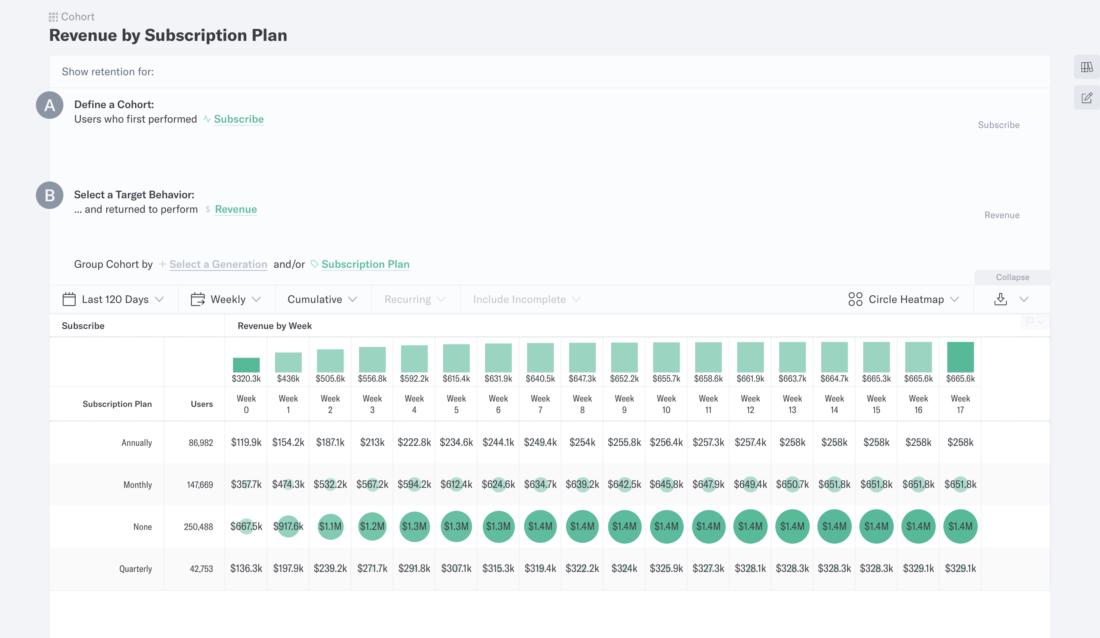
- Select Revenue as a Target Behavior to determine how different behavioral cohorts affect your bottom line
Here’s an example of how this works: Indicative customer, a social media scheduling and analytics tool. They use Cohorts to monitor monthly conversion rates for their upsells. With this knowledge, they can more accurately monitor marketing spend and attribution and more effectively allocate future spend to the campaigns and channels with the highest conversion rate.
Another Indicative customer working in the SaaS space uses Cohorts to understand a key metric for SaaS companies: churn. They analyze Cohorts to understand where in the customer lifecycle churn happens. That gives them a concrete timeline for churn, enabling them to find ways to more proactively discourage churn—by improving user onboarding and targeting customer retention efforts.
Segmentation Analysis
Segmentation analysis is the process of breaking your user base up into groups that share certain characteristics in common. You can segment users by behavior or by user characteristics like location, demographics, or the devices they use.
When it comes to behavior segmentation, you can analyze both event and user-level data. You can segment users based on behaviors like:
- Engagement
- Frequency of usage
- Total time spent in the product
- Usage of specific features
- Inactivity
- Churn vs. retention
Once segmented, you can dig into the granular details that unite those customers. Analyzing those user segments enables you to:
- Optimize for acquisition by identifying the behaviors that correlate with a higher conversion rate
- Maximize engagement by learning how different groups of customers interact with your product
- Uncover the characteristics and behavior of your most valuable customers
- Encourage high-impact usage to drive adoption
Plus, if you use Indicative, you can get even deeper.
You can also use the Trends feature to compare segment behavior against past time periods.
Here’s an example of an Indicative customer: a SaaS company uses Segmentation to understand new signups on a more granular level. On a monthly basis, they segment new signups by geolocation. Knowing where new signups are located helps the marketing team better understand the most profitable locations to dedicate budget and effort to.
Another Indicative customer in SaaS uses the Segmentation tool to monitor active users on the platform. If they find unexpected dips in the number of active users, they know to prioritize deeper analysis to identify the cause—a bug in the app, for example. That way, they can catch issues before they become widespread problems for the wider user base.
Funnel Analysis
Funnel analysis is the process of looking at the customer journey—how leads become customers, how users move through your product—and every step along the way. “Steps” can include events and user behavior, along with marketing assets, sales calls, and other touchpoints with your company.
Mapping out your product and marketing funnel with Product Analytics enables you to get a level of detail and accuracy that other analytics tools simply can’t provide. Funnel analysis powered by Product Analytics can tell you:
- Which customer journeys are most profitable
- How customers are engaging with a new feature
- What do users do after they create an account or upgrade
- How new users behave—and how that varies from how existing users navigate the product
- The actions customers take—and features they use—right before canceling, dropping-off, or churning
In Indicative, for example, you can approach funnels from several different angles.
Using the Journeys tool, you can designate a beginning or ending event and see the most common journeys customers take from or took to get, there. You can expand key journeys to see more detail and create cohorts and segments from the users who follow each journey.
With the Multipath Funnel tool, you can analyze particularly interesting journeys in even more depth, visualize the impact of certain steps on conversion, and more.
Here’s an example from one of our customers: A financial management platform uses funnel analysis to monitor their subscription conversion rates.
The team uses the Multipath Funnel tool to analyze how conversion rates vary for referrals versus other users. That information helps them attribute a dollar value to referrals—instead of just user counts—and prioritize partners based on the value of the referrals they pass along.
Conversion Analysis
To get more customers to a conversion, you need to understand the path existing users took to get there. That’s why funnel and conversion analysis are your most effective tools for growing acquisition and—ultimately—revenue.
With Product Analytics, you can uncover the actual journey real customers follow to get to a conversion. On the acquisition side, you can:
- Find the most optimal path to conversion
- Measure how new marketing campaigns or new features affect conversion
- Identify the features that make customers more likely to convert
And for teams working with multiple conversion points, you can use a tool like Indicative’s Multipath Funnel to:
- Compare free-to-paid conversion rates for multiple paths at the same time
- Identify high- and low-performing steps along the path to conversion
- Explore the customers most likely to convert from free to paid
Getting Ready for a Product Analytics Solution
Sold on the value of Product Analytics yet? Then it’s time to start thinking about choosing and implementing a Product Analytics solution—and there are a few things to think about.
Here, we’ll cover:
- Data management
- Privacy concerns
- Implementing a solution
Data Management
It goes without saying that Product Analytics—or any analytics, really—is built on data. So before you even think about a solution, you need to audit your data management operation and ensure your setup produces clean, quality data for a Product Analytics tool to work with.
Customer and product data is incredibly valuable for driving revenue and growth—but your data has to be accurate and up-to-date. Otherwise, every analysis you perform and decision you make based on that data is just a shot in the dark.
That’s why Product Analytics solutions work best as part of a modern data stack, where data can flow directly from your data warehouse into your Product Analytics platform. That direct integration ensures you have more control over your data and more accurate data overall.
As we touched on briefly before, many legacy Product Analytics tools aren’t built for that. Indicative is Product Analytics built for the modern data stack—the only platform to offer direct integrations with cloud data warehouses, from BigQuery to Snowflake.
Once you have the infrastructure in place, it’s vital to develop a well-documented data tracking plan as the key to making sure the data behind your product decisions is accurate and trustworthy.
If you’re looking for more guidance here, we have a full guide on building your data tracking plan and a tracking plan template to get you started.
Privacy Concerns
Privacy issues around customer tracking are definitely coming to the forefront in the product data space, so it’s important to get clear about what kind of data you’ll collect and store—and how you’ll secure and share it.
It’s understandable to worry that privacy concerns mean you won’t be able to collect valuable behavioral data about your customers; that isn’t as big of an issue when it comes to Product Analytics.
Most of the concern falls with third-party data collection—like Facebook’s cookies that collect broad, sweeping roll-ups of customer data. Modern data stacks that are built around first-party data collection—where you collect on your own customers—aren’t as much of an issue.
With Indicative, you can use that first-party data to power your Product Analytics.
Indicative customers have the option to either:
- Host our Indicative SDK
- Implement an in-house tracking solution (like Snowplow)
Both options avoid the growing concern around third-party data collection.
In our view, data collection should be reciprocal. If you collect data on your own customers and use it to build a better product for them, it’s a win-win.
Note: You can see the full Indicative privacy policy here.
Preparing for a Product Analytics Platform
To ensure a smooth implementation of your Product Analytics platform, we recommend getting your data ready beforehand. We’ll summarize the process below, but you can also read our full guide to preparing for a Product Analytics platform for more details.
Step 1: Determine Your Goals and Use Cases
Indicative’s easy-to-use, no-SQL platform makes data accessible for everyone in the organization. That widens the pool of potential use cases your org can tackle with Product Analytics—so it’s important to define the questions you want to answer upfront.
Here’s an example: if you’re a SaaS company looking to Product Analytics to grow new signups, increase upgrades, reduce churn and boost retention, your product team may want to know:
- Where in the signup flow people drop off
- How feature usage changes before and after upgrade
- Patterns in customer behavior that lead up to churn
Step 2: Identify Data Requirements and Assess Your Needs
Once you’ve outlined your use case, this step is pretty simple. Just ask yourself what kind of data you need in order to answer those questions or accomplish those goals. Start with metrics, then find the data you’ll need to calculate them.
If we stick with the example from Step 1, the product team will need to track:
- Signup flows
- Feature usage
- Upgrade campaign events
- User flows for upgrades and downgrades
- User segments based on churn
- User characteristics
Step 3: Select a Product Analytics Solution
It’s probably no surprise at this point that we firmly believe Indicative is the best Product Analytics platform available. We’re biased—but that doesn’t mean we’re wrong.
Here’s why we think you should choose Indicative:
- Indicative is the only Product Analytics platform that connects to your data warehouse
- Our easy to use, no-code tool means everyone from every skill-level of product managers to marketers can make data-driven decisions every day
- Without having to wait for the data team, business users can quickly access real-time analytics and make faster decisions
- Indicative was built for Product Analytics with the non-technical end-user in mind, to make complex analyses quick and accessible throughout the org

 Indicative Team

