
Companies today need a Customer Analytics platform to enable product and customer insights that are quick to access and easy to understand and act upon.
As a top Customer Analytics platform, one of the most common questions we hear from Indicative prospects and new customers is how to get their data ready. How can you prepare your data for a quick, smooth Customer Analytics implementation?
Here is the process we recommend.
Step 1: Determine Goals and Use Cases
The first step is to identify your use cases for a Customer Analytics platform. What are you trying to learn? What are you trying to achieve? For example, let’s say a SaaS company wants to increase new signups, boost upgrades, lower churn and maximize retention. Their product team may want to learn about:
- Where people drop off in the signup flow
- Feature usage before and after upgrades
- Engagement patterns and customer behavior leading up to churn
With Indicative, anyone can run complicated analyses quickly, with no coding required. That opens up use cases to people far beyond those with statistics or SQL knowledge—enabling the entire team to turn customer behavior data into thoughtful decisions and customer insights. Teams can gain deeper insight into:
- The customer experience and journey between various marketing initiatives and revenue-focused conversion goals
- Drop-off points that lead to churn or lost revenue
- Performance of A/B testing variants
- Sign-up flow performance and drop-offs
- Marketing initiatives that lead to upgrades
- Engagement patterns throughout the product and marketing experience
If you do not get your company on the same page with predefined goals, you may run into issues later on. For example, you may find down the road that you don’t actually have all the real-time data you need to answer your questions.
Setting out goals from the start also helps align internal stakeholders—including engineers and business users—which ensures a more cooperative process later when you integrate your data into a Customer Analytics platform like Indicative.
Step 2: Identify Data Requirements
The next step begins with identifying the data points you need. What information do you need to achieve the goals outlined in Step 1?
First, identify your metrics. Then determine what data you’ll need to create these calculations. You’ll want to identify both the user actions and associated metadata required.
Using the example from above, our SaaS product team would need to track:
- Step-by-step signup flows, along with device and UTM information
- Feature usage (such as clicks and error messages)
- Upgrade campaign events (email click-throughs and CTAs, for example, mobile push notifications, or in-app notifications)
- User flows for upgrades and downgrades
- User segments based on behaviors (This can be done through segmentation)
- User data such as subscription type and location
If you aren’t used to building tracking plans, this process can be challenging — but our sales engineering team can help.
Step 3: Assess Your Data Needs
To run effective analyses in your Customer Analytics platform, you’ll need log-level event data that allows you to perform analyses at aggregate levels. Your event data should include the following fields:
- Event name, so you can identify the action
- Timestamp, so you can see when the action happened
- User ID, so you can see who completed the action (This can be an authenticated ID or unauthenticated ID, or both.)
- Additional metadata (like attribution and device information, subscription status, demographic information, location, and more)
These fields give consistent structure to your data, ensuring all the information you need is in your data warehouse.
Do you have all the data you need, based on the requirements outlined in Step 2?
I have the data I need
Great—your data is validated and ready to go. You’re ready for Step 4.
I don’t have the data I need
Your engineering team will need to do a bit more work, then—either creating a custom pipeline through or selecting a platform for data collection and tracking.
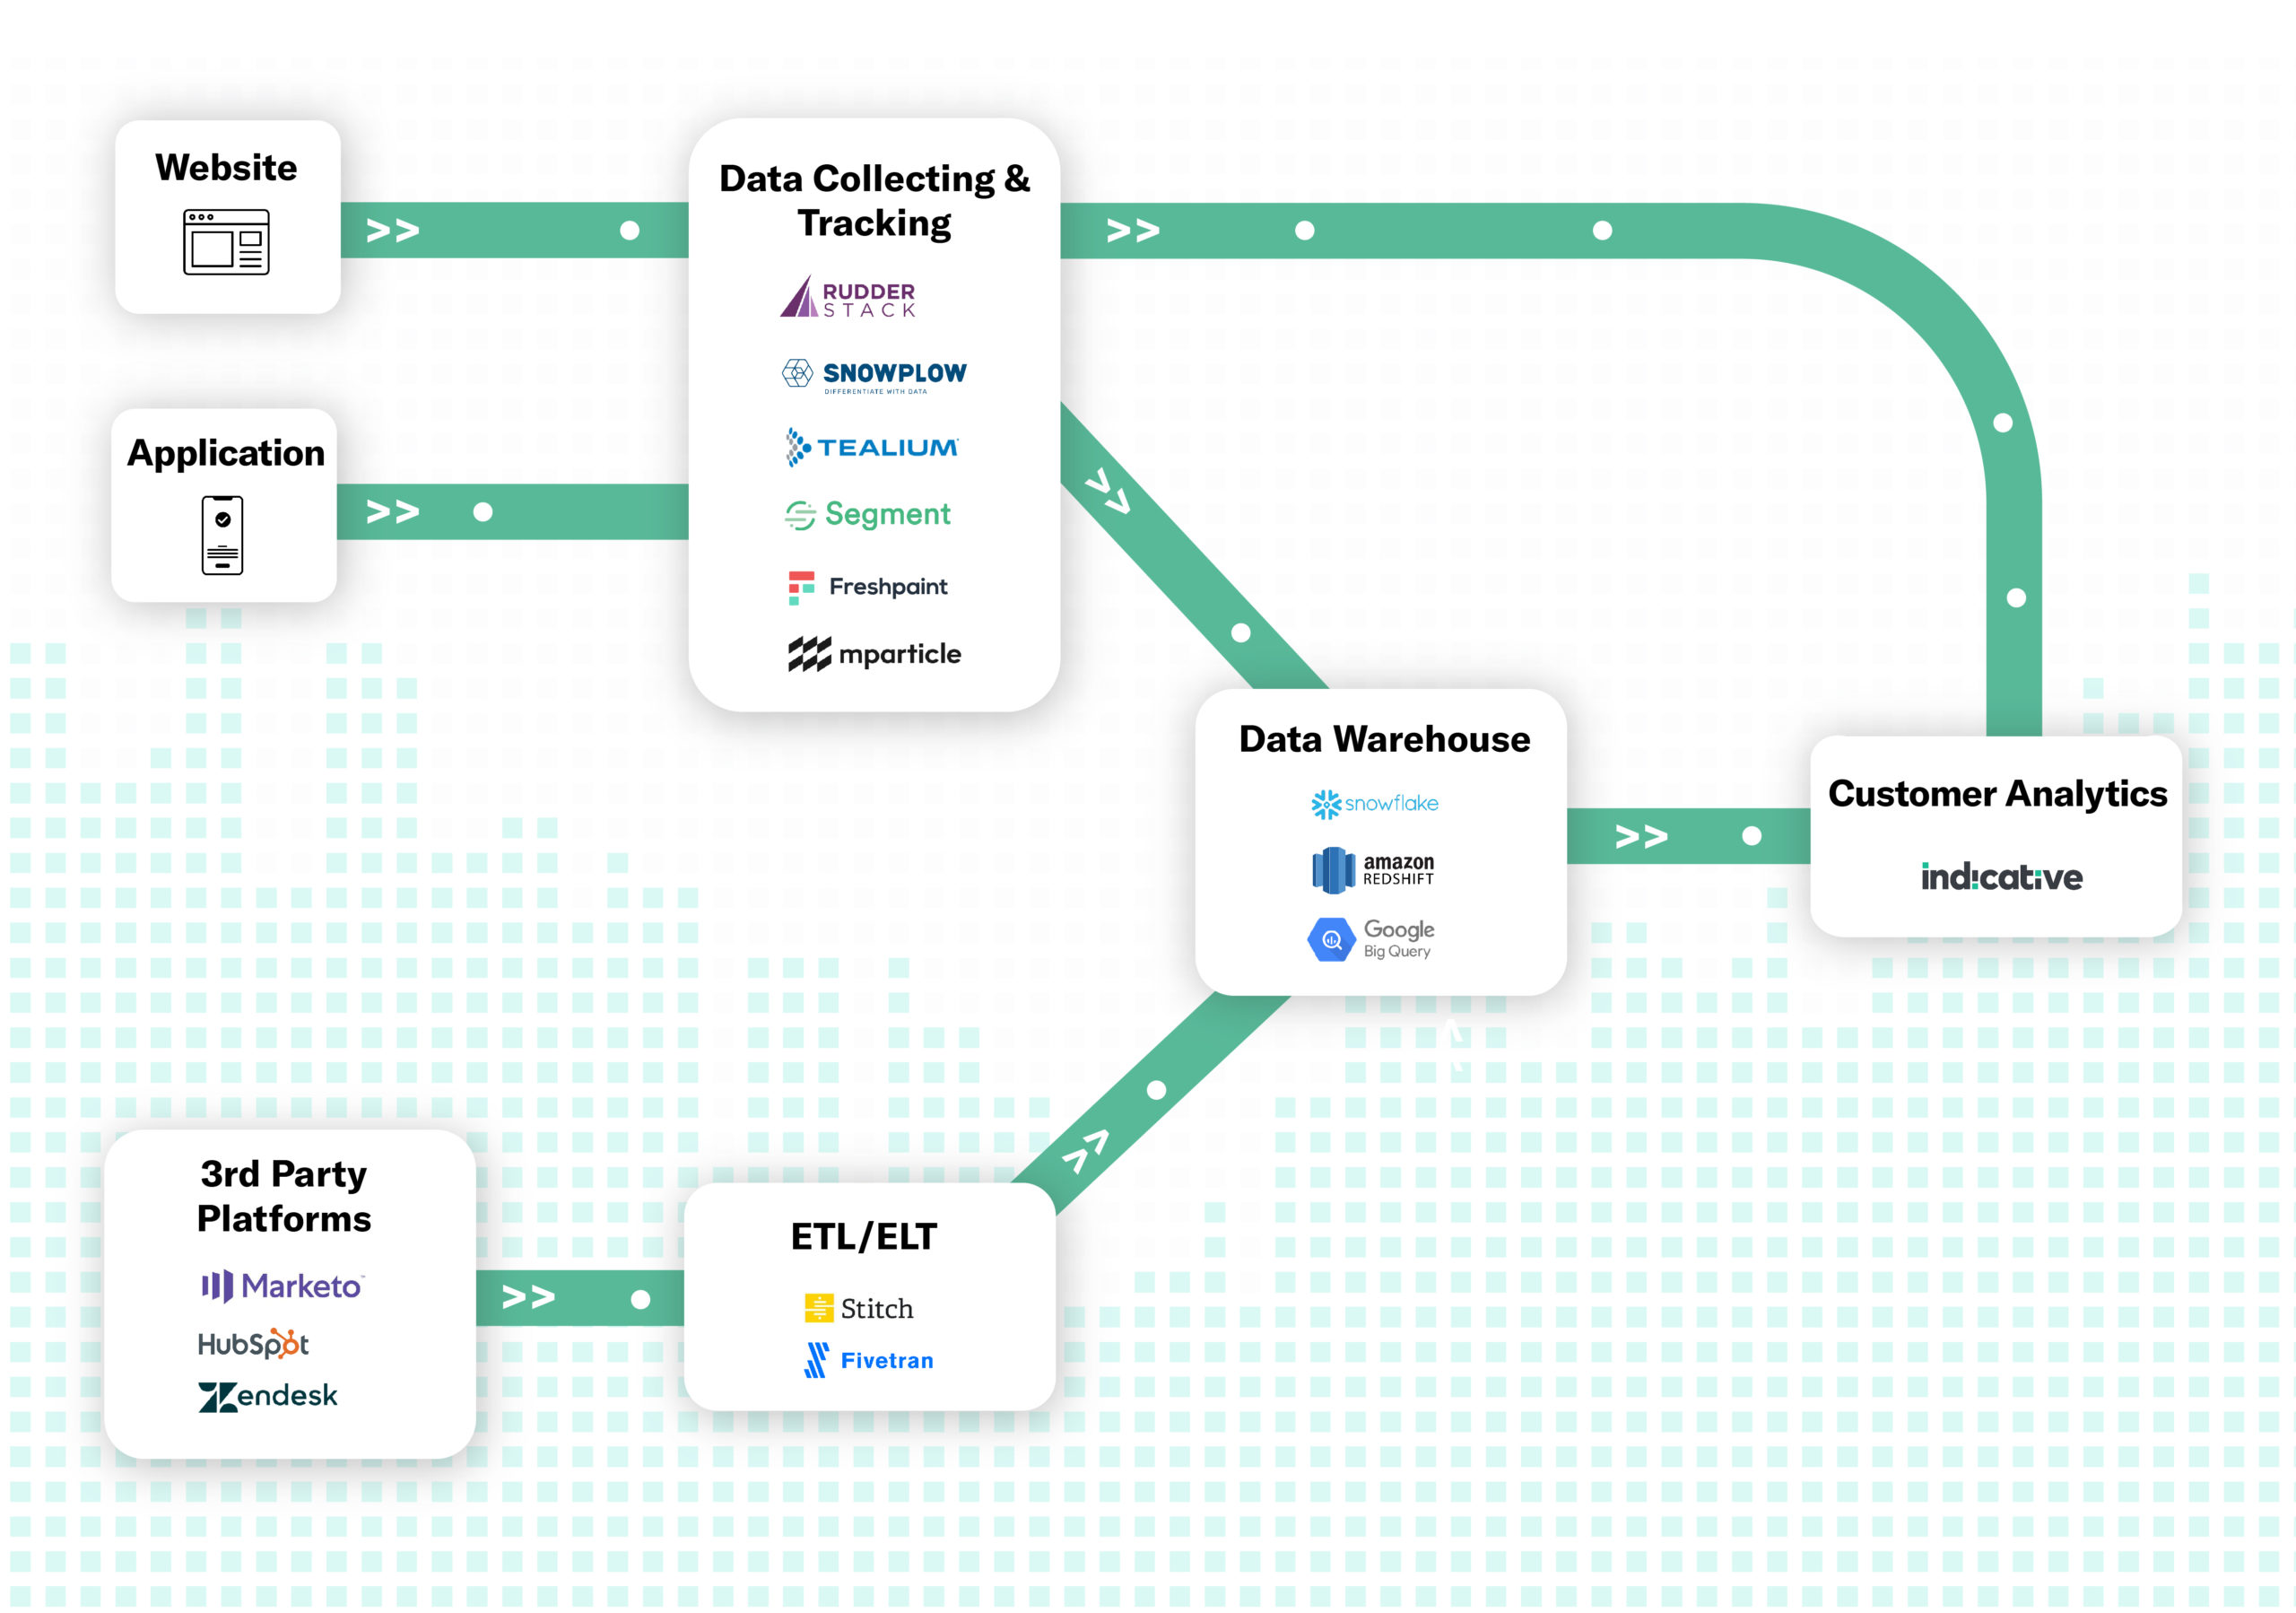
Examples of data collection and tracking platforms include:
(Find a more detailed breakdown of these tools here.)
From here, the next step is to develop a data tracking plan. This plan should:
- Summarize the events and properties you need
- Include a definition or description of each
- Detail where they’ll be added in the codebase
- Inform stakeholders of progress/completion
If you need to include third party data from platforms like Salesforce or Zendesk, you can use a CDP like Segment or an ETL platform like Stitch Data or Fivetran.
When choosing, consider any other data you may need, such as user data like subscription status, attribution, and location data. It is valuable to aggregate this user data into a user profile table or dataset.
Once your stack is chosen, have your engineering team implement, Q/A, and validate the tracking—making sure your data is ready for use.
Step 4: Clean Up and Organize Your Data
As common a problem as incorrect reporting is, few companies adequately prepare for it ahead of time. That’s when the problem becomes unmanageable and costly.
Here’s what you need to do to make sure that your data is in good shape from the start.
Create a Unified Dataset
Create a single unified dataset that brings information from all your data sources together, forming a central source of truth. Here’s how:
- Establish a unified identification system. Your business intelligence and Customer Analytics platforms need to deliver a unified view of your customers. For example, you’ll need logic to map the Zendesk ID in your Zendesk data to a customer or visitor ID in your website data.
- Synthesize different sources. You need to be able to map server-side data (like order confirmations) with client-side (like app clicks) and third-party data (like Zendesk live chat interactions) to contextualize user behavior at a higher level. Ideally, these various sources can be unified into one schema. For example, if you’re using BigQuery, it is best to have a single unified events table as opposed to one table per event.
- Ensure consistency. When synthesizing different data sources, oftentimes field names may vary even if they represent the same thing. It’s important to unify the schema and field names to ensure simplicity. For example, different datasets may represent a user’s device type as device_type, deviceType, or dvce_type.
- Create lookup and reference tables. This allows you to enrich the event data with additional context. For example, a B2B SaaS platform may have event data that includes a company ID. A lookup table may have additional context based on company IDs, like company name or subscription type, that can be used to enrich the event data.
Here are some tips to keep in mind as you create a unified dataset:
- Keep it simple. Easier said than done, but complexity creates room for error. With more rules, data models become more difficult to interpret. Dedicating time to think through the simplest and most efficient way to model the data means fewer potential complications downstream.
- Get your data ready. If your analytics platform integration is batch extraction based (like Indicative), you need a way to identify new data—so that it can be marked as ready for loading. Common ways to identify data ready for load are: including dates in the S3 file names, partitioning BigQuery data by ingestion date, or including an updatedAt or addedAt field. This process will ensure that you can identify data that is ready to load since the prior batch load run.
- Use UTC for ubiquity. As your data analytics stack scales, information needs to flow freely between systems. Coordinated Universal Time (UTC) is ubiquitous, meaning chances are time zones in every tool in your analytics stack use it. Using UTC prevents interoperability issues before they take place.
- Select a time zone field. Carefully consider which timestamp you want to use because once you get up and running it’s difficult to change. We typically recommend using the server-side timestamp because using the client-side timestamp can be manipulated by the user. This can cause larger issues, like data being erroneously represented as having occurred days or even decades in the past or the future.
Develop Documentation
Documentation serves as both a historical guide and an educational resource that makes your data easier to access, interpret, and ultimately use.
Your documentation should include the following:
- How to access data. If it’s in S3, for example, wherein the S3 bucket does certain data live? What format (parquet, JSON, etc.) are the files in?
- How to interpret data. Given all the considerations above, what is the right way to query and analyze the data?
- Who is the right resource for questions? You need an owner to be the expert on the data model—who can field questions from the rest of the team. This may be a different resource from the owner for data access.
- A data dictionary. This helps end-users understand what the data represents. For example, does “Confirm Subscription” represent when the user clicks the confirm button or when the subscription is successfully processed and confirmed by the server?
Once you’ve completed this step, your data is ready for a Customer Analytics platform.
Step 5: Select a Customer Analytics Platform
Now that your data is ready, you’ll need to choose a Customer Analytics platform to maintain a single source of truth within your data warehouse. Here’s why we believe Indicative is the best option:
- Ease of setup. Indicative can connect directly to where your data lives and is the only Customer Analytics platform that connects to your data warehouse. Other customer analytics platforms (like Amplitude and Mixpanel) require you to track everything using their SDK—which can lead to discrepancies and data quality issues—or build a pipeline to bring data from your warehouse into the platform—a process that requires a lot of engineering resources.
- Simple, no-SQL user interface. With Indicative, there’s no SQL or coding required to run analyses. That means business users, from product managers to marketers, don’t have to rely on the data team to make data-driven decisions.
- Quick access to advanced real-time analytics. Instead of opening a ticket with the data team and waiting weeks for results, business users can ask and answer their own questions, right away. That means faster, more thoughtful decisions.
- Built for customer analysis. SQL and BI platforms weren’t designed for customer or behavioral analysis. Indicative was built for Customer Analytics, making complex analysis quick and accessible across the organization. In fact, we even wrote extensively about the difference between business intelligence tools vs Customer Analytics, and why you need both.
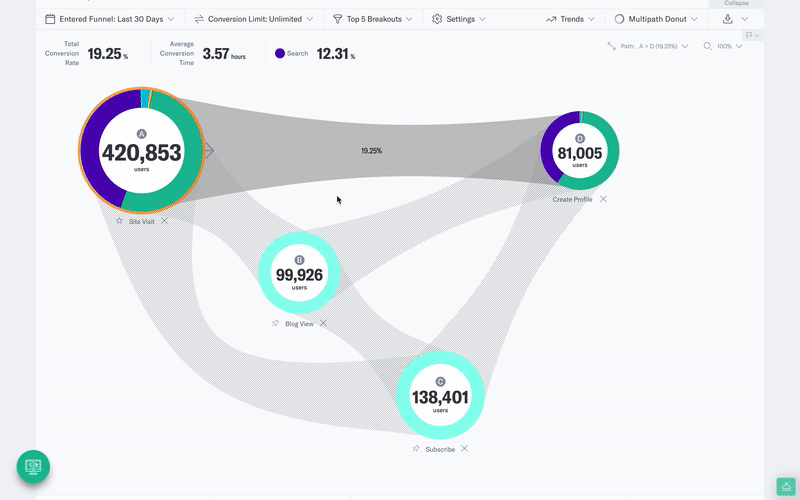
Indicative’s multi-path funnel analysis allows you to compare multiple user journeys to find the optimal path to conversion and is just one example of an analysis that takes seconds to build but would be overly cumbersome and time-consuming using SQL.
In the video below, for example, you can see the customer journey for a cohort of users who sign up from an email marketing campaign. You can then navigate to different sign-up flows and see how each group varies.
Try for yourself, and Enter our Product Demo.


