
Product management analytics is the key to becoming a more data-driven and customer-centric organization. It’s a huge part of a company’s modern data stack.—making customer and product data more accessible and digestible—and a vital ally in driving product-led growth.
Here, we cover:
- What product management analytics is
- Why it matters
- The 3 stages of Product Analytics maturity (and how to level up)
- How to analyze product management analytics
- When to invest in a Product Analytics tool
What Is Product Management Analytics?
Product management analytics is a set of tools, metrics, and analyses that help product teams develop a more well-rounded view of users and how they engage with products.
By using product management analytics, product managers (PMs) are able to understand user behavior within a product, break out high-performing segments and cohorts of users, and visualize the user journey. With analytics like that, companies can:
- Build products users happily pay for
- Convert and upgrade more customers, accelerate user growth, and increase revenue
- Grow retention and lifetime value, mitigating churn and protecting revenue over the long term
In other words, Product Analytics helps teams turn raw data into actionable insights you can use to build better products and grow revenue.
Why Product Analytics Matters
Product teams exist to build better products for users and help the company grow. But in a lot of orgs, there’s a gap between the lofty ideal of “a better product” and the day-to-day work product managers do.
When there are infinite changes product teams can make, product management analytics helps guide and prioritize them, so your product team can identify what “a better product” looks like for your users—then spend time on the highest-impact work.
Here’s an example from one of our customers:
BentoBox helps restaurants build and maintain online delivery service. At the beginning of the COVID-19 pandemic, they wanted to help customers (restaurants) who were struggling financially.
They had an idea to test a $1.99 “Covid Relief Fee” to each order. However, they didn’t want the fee to turn users off and end up costing restaurants money, so the team used our Multipath Funnel tool to keep a close eye on conversions.
In the end, the fee didn’t impact conversions—but it did end up generating nearly $550,000 in revenue for their restaurant partners.
Read the full BentoBox case study here
The Right Metrics for Your Product Management Analytics
There are tons of analyses and metrics you can perform that fall under the Product Analytics umbrella—so how do you choose the right product metrics?
We’ve talked in-depth about choosing your product metrics elsewhere, but here’s a quick summary.
The most common product management metrics include:
- Active users
- Usage frequency
- Adoption rate
- Feature adoption
- Activation rate
- Engagement
- Retention
- Churn
Those are all great indicators and well worth measuring. But to keep your product management analytics strategy actionable, we recommend using a 3-layer framework that breaks down your North Star goals into complementary metrics (read more about the framework and how it works here).
Let’s look at an example of the framework in action: a SaaS company sells accounting software and wants to grow revenue. They’ve identified that active usage is crucial for both long-term retention and plan upgrades.
- North Star metric: weekly active users (WAU)
- Layer 2 metrics help them drive weekly active usage: user acquisition, activation rate, product adoption, usage frequency
- Layer 3 metrics help them prioritize and take action to toward layer 2 metrics: churn as a percentage of new signups, adoption rate by feature, time to value, 7-day retention, time to upgrade
Scaling Your Product Analytics Maturity
Product Analytics look different at a startup than they do at a mature enterprise company.
As your organization grows and matures, so will your data and analytics operation. When it comes to product, analytics maturity tends to develop along four key avenues.
- Data collection: Startups may collect event and user data on a relatively small user base. As the business grows, companies collect more data points on more users. That means a more complex tracking plan, bigger storage needs, and (sometimes) transformation tools get added into the mix.
- Depth of analysis: Startups often focus on surface-level analysis like business metrics and conversion. More mature enterprises move to deeper analyses that allow for testing and exploratory analysis.
- Collaboration: In a startup, data and analytics are largely handled by a data analyst, who queries data, fields requests from the rest of the team, and shares data across the org. In a mature data setup, everyone has direct access to analysis.
- Product metrics: Startups tend to stay focused on broad product metrics like conversions and active users. As your org matures, you can build out a framework that ties specific and actionable product metrics back to broader business goals, charting a clear path for how PMs can build better products and drive revenue.
Start by Auditing Where Your Team Is
Before you can effectively scale your analytics operation, you need to know where your team stands today. To do that, you’ll audit your current Product Analytics setup based on the 3 stages below—then, use that as a baseline to determine your next steps to level up.
Stage 1: Early stage data collection and strategy building
What this stage looks like:
In this stage, while you may have some data, you don’t have visibility into user behavior within your product, and you don’t have a set strategy for what to collect or how it’s used. Data likely isn’t universally accessible across the org, so it isn’t a key part of day-to-day decision making. Any data and analytics tools (like Google Analytics) are implemented on an ad hoc basis, not as part of an end-to-end data stack.
Gaining visibility into what customers do, where they spend their time inside your product is crucial at the startup stage because it can help guide early product development.
Let’s look at an example from one of our customers, Liv Up. At first, they built and connected tools in an ad hoc way, building a “simple, amateur, non-scalable platform.” Here’s how Head of Data Luiz Arakaki explained the beginning stages of scaling up their data operation:
“We built dashboards to monitor main business metrics, integrated several data sources into a single source of truth, and developed simple analyses to support business decisions. We got the basics: automated reports and metrics.”
How to scale up:
- Build a tracking plan to ensure you’re getting all the data you really need
- Implement a holistic data and analytics stack with tools that work cohesively together, including a Product Analytics tool (Indicative includes your first 50 million events for free)
- Build out dashboards and reports you can use as a jumping off point for deeper analysis later on—focus on what users are doing in your product
- Begin to set a company-wide precedent that data should help inform and validate strategy
Stage 2: Data-informed decisions
What this stage looks like:
You use data to inform overall strategy, but it isn’t complete or always used in roadmaps or other day-to-day decisions. Multiple teams across the org can see data, but not always interact with or query it—they still rely on the data team to run SQL queries and pull data for analysis. Decisions are validated with data, but not necessarily driven by it.
Let’s look at an example from Atlassian’s Confluence software. At Atlassian, product managers, designers, and everyone in between are empowered to ask questions about product usage and better understand the impact of their product for users. They’ve built out an analytics stack to enable that kind of autonomous question-and-answer access.
But they didn’t have all the data and answers they needed for some of their older products, like Confluence. To level up analysis on that product, they needed to expand their usage of Product Analytics.
How to scale up:
- Implement a Product Analytics tool to democratize data, so it’s accessible and digestible for all team members
- Empower PMs to ask questions of the data and conduct exploratory analyses to figure out why users behave the way they do
- Set an organization-wide precedent that data should be part of day-to-day decisions
Stage 3: Data-led product development and iteration
What this stage looks like:
Your product team works in a constant iteration loop based on data and product improvements. Your analytics tools enable everyone to ask and answer their own questions, in real-time, and your roadmap is built based on product and customer data. This is the end-game for product management analytics—but it isn’t the end of the road. You can always continue to expand and scale
Let’s look at an example from another one of our customers, Prezi. They’ve built out in-depth user flows and feature usage dashboards that enable them to identify—in real-time—user drop-offs, points of friction, and how customer segments diverge from the expected customer journey.
When the team launched a new product called Prezi Video, Product Analytics were a key part of the roll-out. By monitoring user flows, they ensured users adopted the new feature and made quick changes to alleviate friction and speed adoption.
You can read the full Prezi case study here.
How to scale up:
- Continue to ensure everyone in the org feels empowered and able to ask and answer their own questions with data
- Expand your tracking plan as needed and explore new ways to use your product data
How to Analyze and Operationalize Product Management Analytics
Once your data stack and product management analytics platform are in place, there’s a whole host of analyses you can run to get a better sense of your customers, their behavior, and how you can improve the product toward all kinds of goals—from revenue to retention.
There are the four main product analysis tools you can use to analyze to turn data into a better product. Each tool can help at each stage as your company and data operation scale.
For startups, use…
- Funnel analysis to find out where conversions and drop-offs happen
- Customer journey analysis to gain visibility into how users navigate your product
For mid-sized companies, use Funnel analysis and Customer Journey analysis and…
- Segmentation to find your best customers
- Retention analysis to mitigate churn
For enterprise companies, use everything in startups and mid-size companies and…
- Retention analysis to increase retention and LTV
- Cohort analysis to understand the why behind user behavior make continuous product improvements
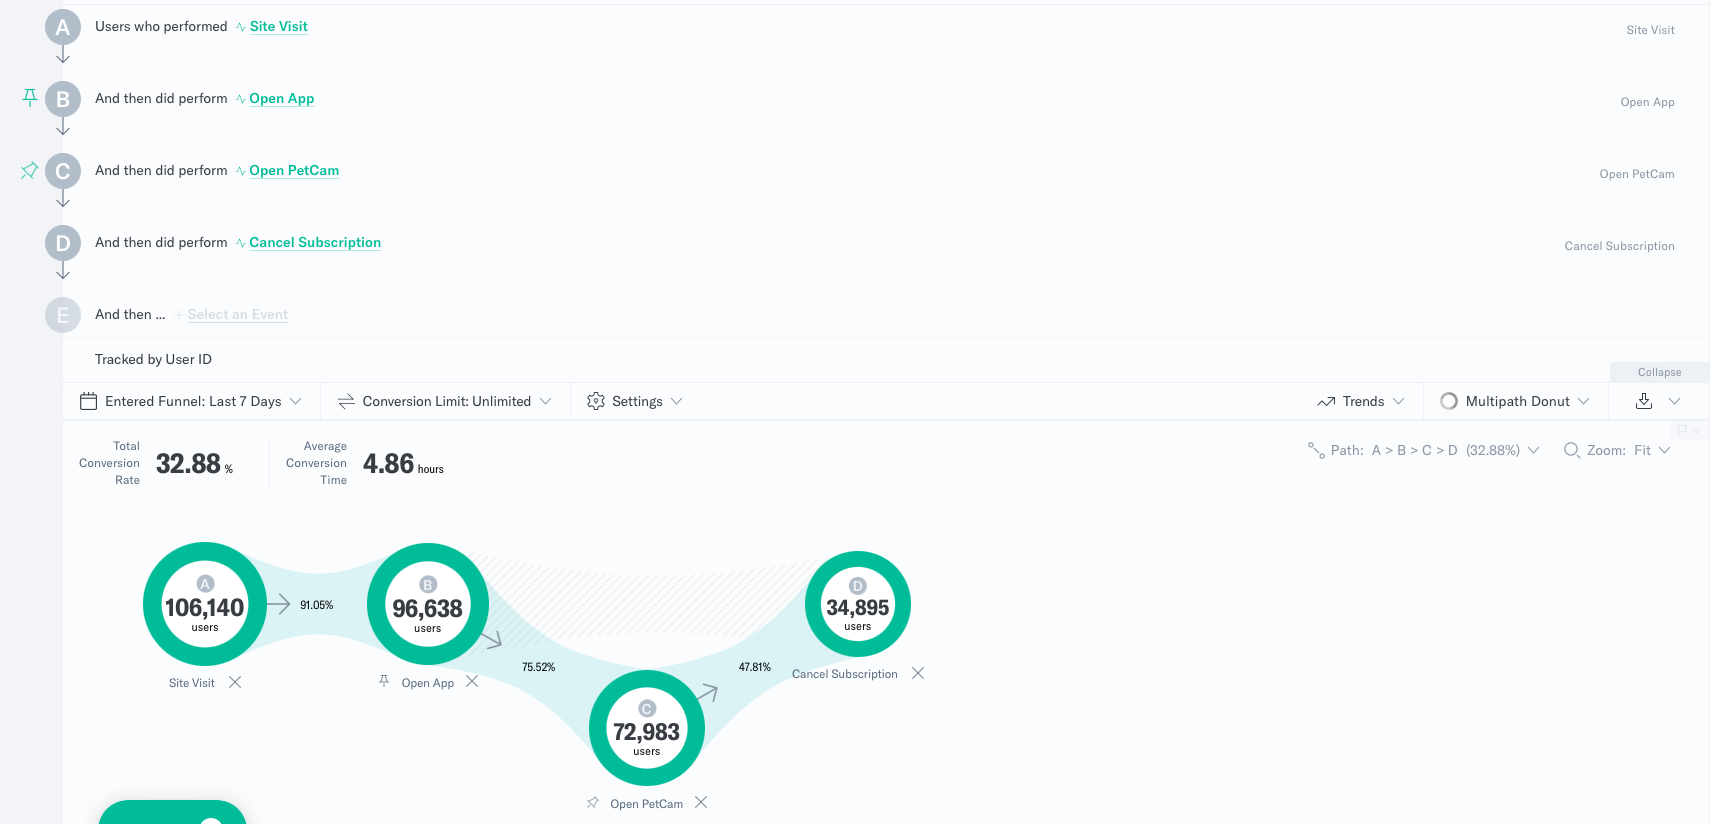
Customer Journey and Funnel Analysis
With customer journey and funnel analysis, you can identify the steps users follow along the path to key events like:
- Initial conversion
- Upgrade
- Churn
Using our Customer Journeys tool, for example, you can visualize the most common paths users follow before or after a given event.
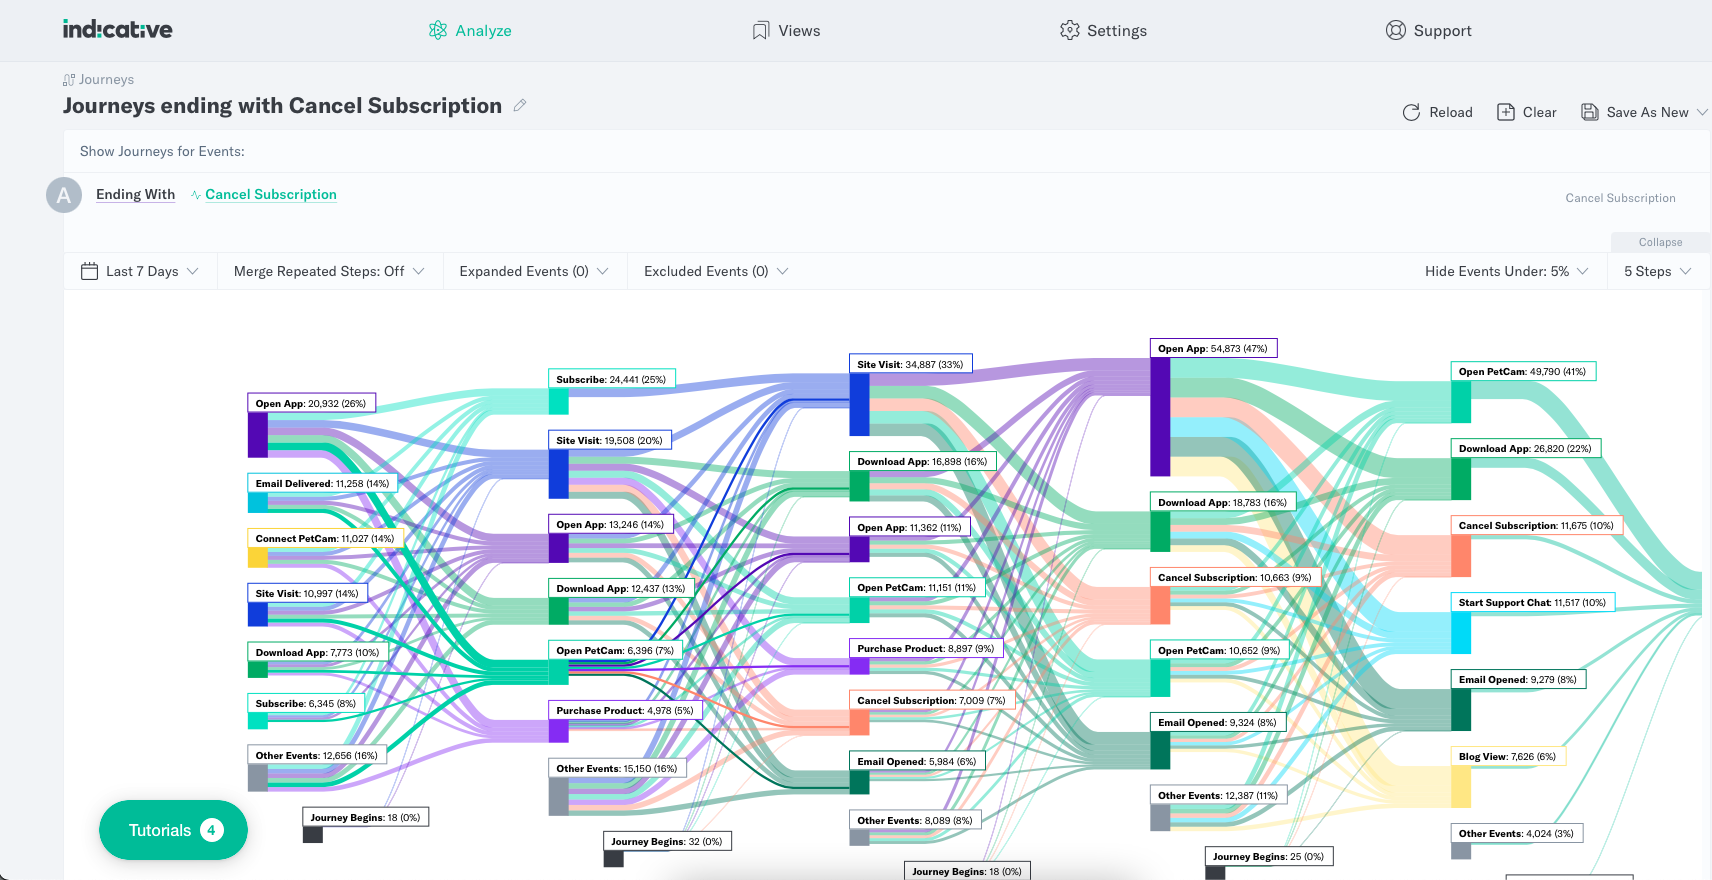
In Multipath Funnel, you can dig deeper to see how each step of the journey impacts key factors like conversion.
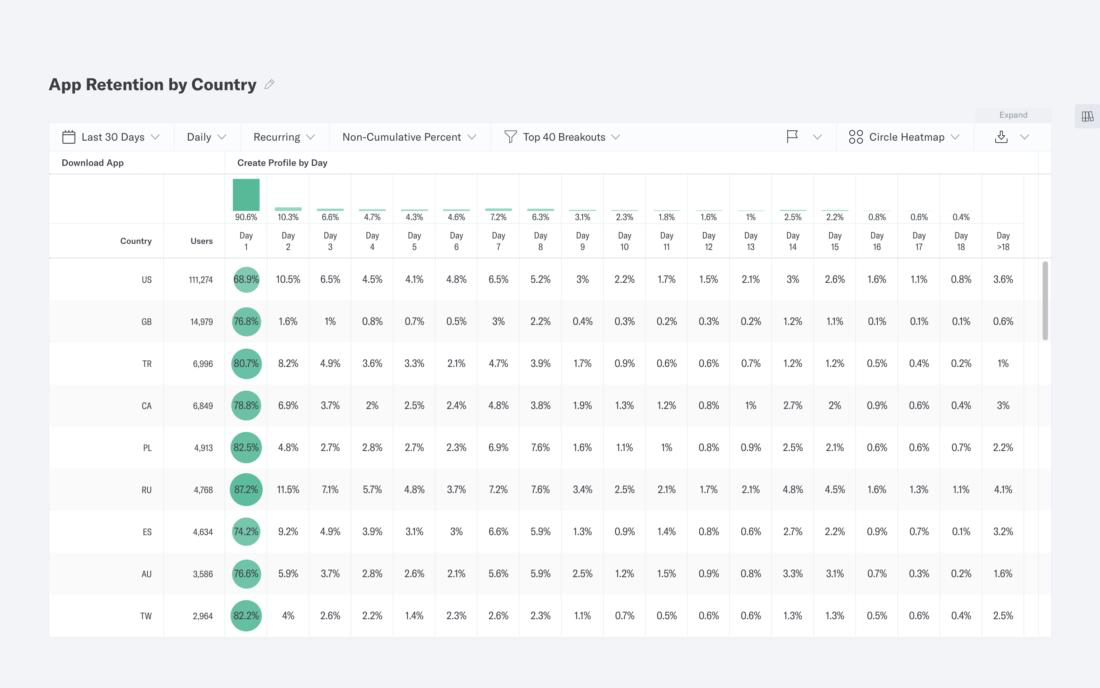
Segmentation
With our Segmentation tool, you can group users into segments based on behavioral or user characteristics, then analyze that segment of users to see how conversion, usage behavior, retention and churn, lifetime value, and other product metrics vary from the overall average.
Identifying users who exhibit frequent usage, full adoption, long-term retention, and higher than average revenue per user can help shed light on the type of customers you want to target and the behaviors you want to encourage.
Cohort Analysis
Cohort analysis enables you to analyze a specific cohort (or group) of users over a period of time and track aggregate metrics for that group. By tracking the cohort of users who complete your onboarding flow, for example—and comparing them against users who didn’t—you can measure the impact of your onboarding.
One Indicative customer in the educational SaaS space, for example, uses cohort analysis to find out when enrolled users drop-off. Once they identified the drop-off point, they dug deeper to see why drop-off happens there and found opportunities to re-engage those users.
Retention Analysis
Retention analysis is all about reducing churn by figuring out who churns, who doesn’t, and why—and it often draws on the other analyses we mention here, including segmentation, cohort analysis, and funnel analysis.
Through in-depth retention analysis, you can:
- Learn who your most valuable users are
- Figure out where and how to attract more of them
- Flag behaviors that indicate churn risk and marshal support to stop churn before it happens
- Identify points of friction that cause churn and proactively fix them
- Set scalable KPIs and benchmarks to improve retention and churn metrics
When Should a Company Invest in a Product Management Analytics Tool?
Want a simple answer to that question? Right now.
The truth is, no matter what stage your company is at, product management analytics can help you grow. They help you understand your users, build a better product, and reap the revenue benefits of both.
Still, the way product management analytics is used within a company will vary based on the size and complexity of your team.
What Does Product Management Analytics Look Like for a Startup?
At the startup level, Product Analytics often falls to the most technical founder to handle. Even if you have a data analyst or a small data team, they’re burdened as the ones fielding requests from the rest of the team and running queries for other individuals.
Your overall data stack may still be a little ad hoc—which can limit what you can do with product management analytics—but broad strokes product data can still be a part of your overall strategy.
What Does Product Management Analytics Look Like for an Enterprise?
As companies grow, so does usage and potential for product management analytics. In enterprise orgs, there’s usually a full data team focused on ensuring data accuracy and security. Day-to-day product analysis, then, is democratized and accessible for product managers, marketing managers, UX designers, customer support reps, sales reps, and more. They can ask and answer their own questions by directly engaging with the data, and because it’s fast and democratized, data is a big part of day-to-day decision-making, roadmap planning, testing, and validation.
Choosing a Product Management Analytics Tool
Ready to get started? Here’s what matters most when it comes to choosing a Product Analytics tool.
- Flexibility and scalability: Your product management analytics tool should be flexible enough to work for your business and your users—and able to grow right along with your needs.
- Direct connection to your data: At Indicative, we know that, no matter how big or small your business is, you need data that’s accurate, trustworthy, and real-time. That’s why we’re the only Product Analytics tool to connect directly with your data warehouse. With product analytics that connect directly to your data warehouse, you can marry a user’s online and offline data easily, and you won’t need to run SQL or code to pull the insights.
- Budget and pricing: Depending on your business stage, some Product Analytics tools may be more than you need… and have a price to match. At Indicative, we include 1 billion events for free.

 Indicative Team

