
Product adoption is the key to reaching nearly every business goal. Reducing churn, increasing revenue, upgrading customers… they all rely on how well you get users to fully adopt your product.
Here, we cover:
- What product adoption is
- How to measure it
- How to increase it
What Is Product Adoption?
Product adoption refers to the process customers go through to become aware of your product, find the value in it, and become regular users.
It’s a simple concept, but “adoption” looks different for every organization. Measuring it comes down to how you define adoption for your product.
Take Instagram for example: the company may consider users who download the app, signup, and begin posting to have adopted the app. They may also consider liking or commenting on someone else’s post as adoption. Or, they may not consider a user to have adopted the product until their third post.
Users have to take action to fully adopt a product, and value is what drives them to do that. Adoption happens when a user has their “Aha!” moment and the value of your product “clicks” into place for them.
Product Adoption and Product Analytics
Improving product adoption means helping more users reach that “Aha!” moment. To do that, you need a way to track, measure, and analyze user behavior within your product.
That’s where Product Analytics comes in, allowing you to deeply understand your users and how they behave inside your app.
For example: If adoption means converting from a free to a paid subscription, you need to know how people who convert to paid behave, and how those who never do behave.
That’s one of the ways an image leasing marketplace, uses Indicative. Their team had questions:
- How many assets does the average user download?
- How does that vary across free and Pro users?
- How many users perform a search, filter a search, or use the editor?
With Product Analytics, they can answer those questions quickly—helping further define what adoption looks like for them and uncovering behaviors and feature usage that correlate with high adoption.
What Is the Product Adoption Curve?
The “product adoption curve” is a visual that conceptualizes how and when different segments of the market adopt new products.
When your product is brand new to market, customers who adopt it have different motivations and expectations than the users you’ll have once you establish the product.
The adoption curve visualizes each type of user as your product matures. There are 5 stages:
- Innovators: This segment is small but important for new businesses. Your first customers, they’re excited by new technology and will deal with some bugs and hiccups to access it. Early usage can help power your minimum viable product (MVP) and be a source of invaluable product feedback.
- Early adopters: Motivated by a strong need for your product—rather than desire for all new tech—they’re more interested in innovation than novelty. They expect your product to perform as promised and have the resources to invest in the right solution.
- Early majority: Early and late majorities like established, proven products. Developing a strong relationship with the first two segments is key because they can convince the majorities to give you a shot. Once they do, they’re likely to become loyal adopters and long-term customers.
- Late majority: These users are like the early majority, only more risk-averse. They take longer to jump on board because they’re looking for established, mature, and bug-free products.
- Laggards: This last group really doesn’t like change. They prefer products they’re familiar and comfortable with, only changing when they have to.
How Do You Measure Product Adoption?
There are several key product adoption metrics you can use.
The trick to really understanding what adoption looks like for your product is to use a mixture of them to build a well-rounded, holistic view. You want to understand the who, what, when, and how of adoption for your users.
- Who fully adopts the product? What percentage of your user base is fully adopted? What behaviors or characteristics do they have in common?
- What features do they adopt? What are their use cases for the product? How often do they use specific features?
- When in the customer lifecycle do users fully adopt the product? How long does adoption take?
- How did they get to adoption? What steps did they take? What support did they need?
By analyzing each angle, you can gain better insight into adoption and, crucially, how you can encourage more users to adopt, faster. That enables you to prioritize features important for adoption, develop feature launch plans to speed adoption, and more.
What Are the Best Metrics to Track?
Approaching product adoption from all those angles requires a mix of specific metrics, including software and app-based adoption metrics and customer adoption ones.
Software and app adoption metrics
The most important, bottom-line adoption metric to track is active users. Depending on your product, that may be monthly active users (MAU), weekly active users (WAU), or daily active users (DAU).
To measure, you’ll need to come up with a standard definition for “active use.” That may be as simple as opening the app and logging in or something more complex.
Measuring how many customers actively use your product on a regular basis tells you how widely adopted the product is among your user base and serves as a building block for some of the customer metrics we’ll get into next.
Customer adoption metrics
For our purposes here, we’ll highlight the four most important customer metrics for measuring adoption.
Adoption rate
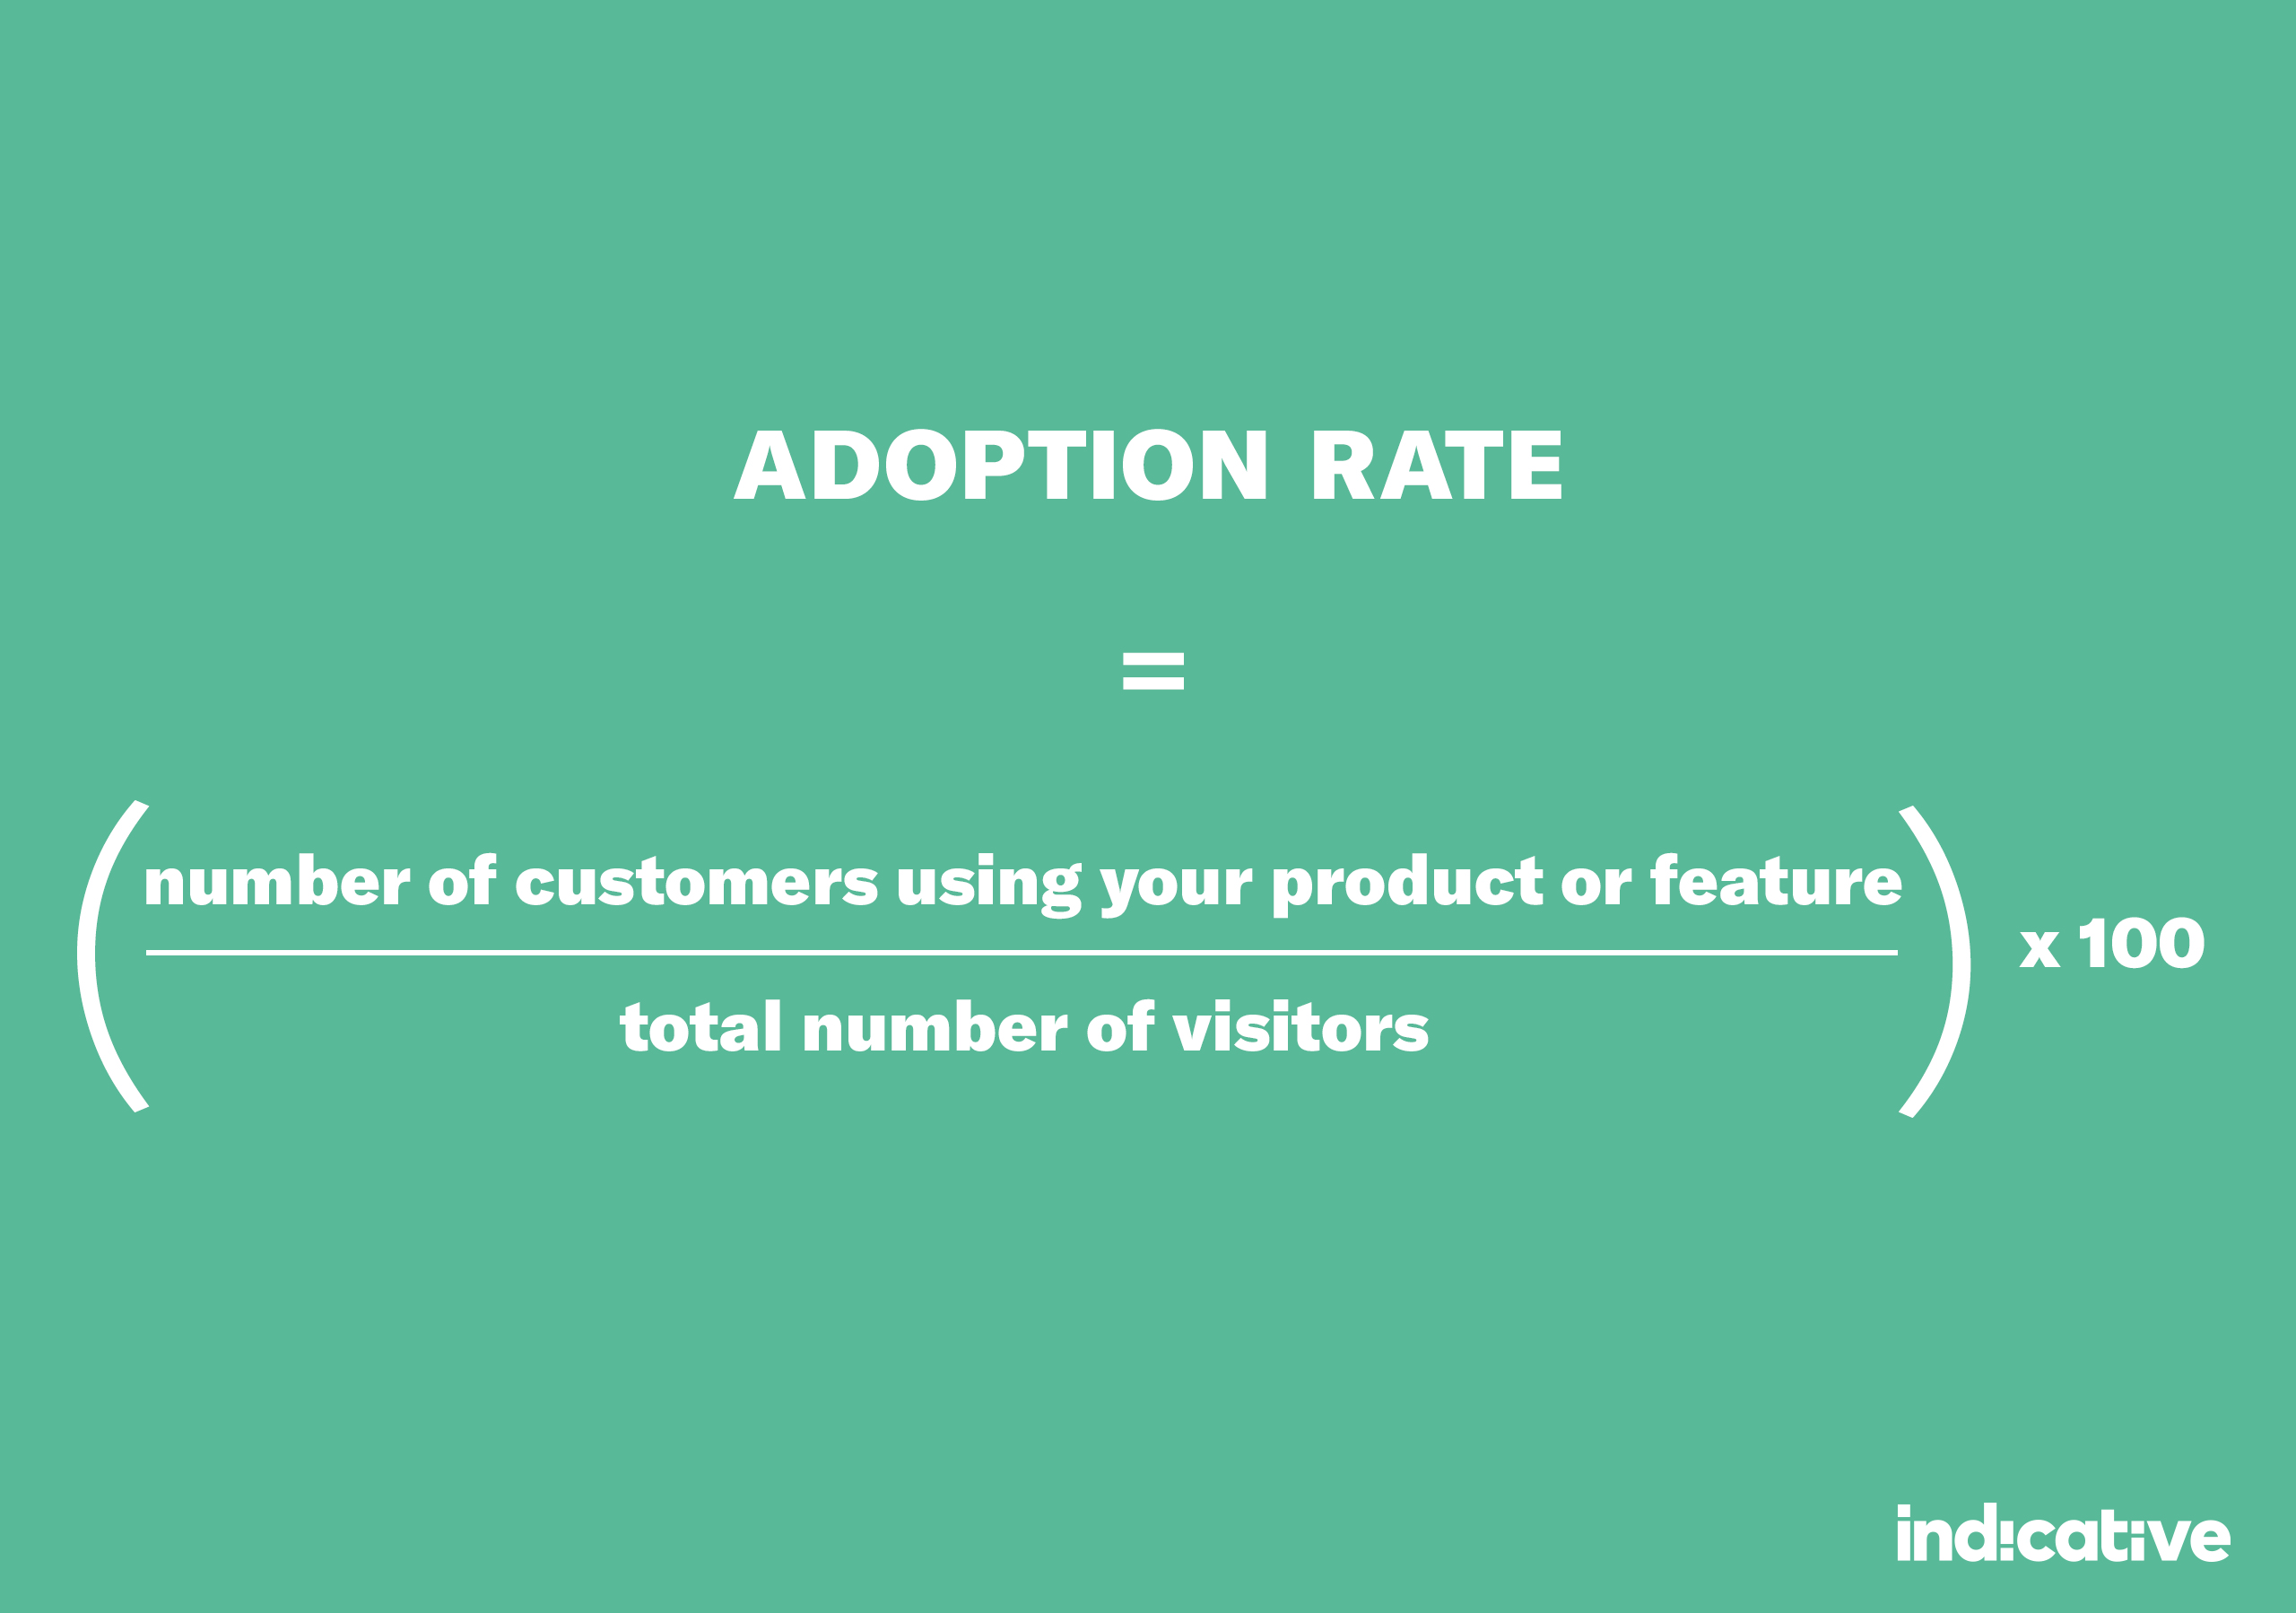
Your adoption rate is the foundational measure of adoption. It tells you, of your user base, how many are regular active users.
Calculating your adoption rate opens the door to further analysis, like measuring how rates vary across each feature within your product, for example, or across different cohorts of users. That insight can help you plot your roadmap—by showing you which features to prioritize and develop (or sunset)—find your best customers, and understand the impact of different factors on adoption.
You should also keep an eye on your adoption rate over time to understand whether efforts to increase adoption work.
Plus, having a pulse on your normal rate can help you quickly identify and address problems. If adoption rates unexpectedly drop, you’ll know to look deeper to see if a failure, bug, or other friction is stopping users from fully adopting.
Conversion rate
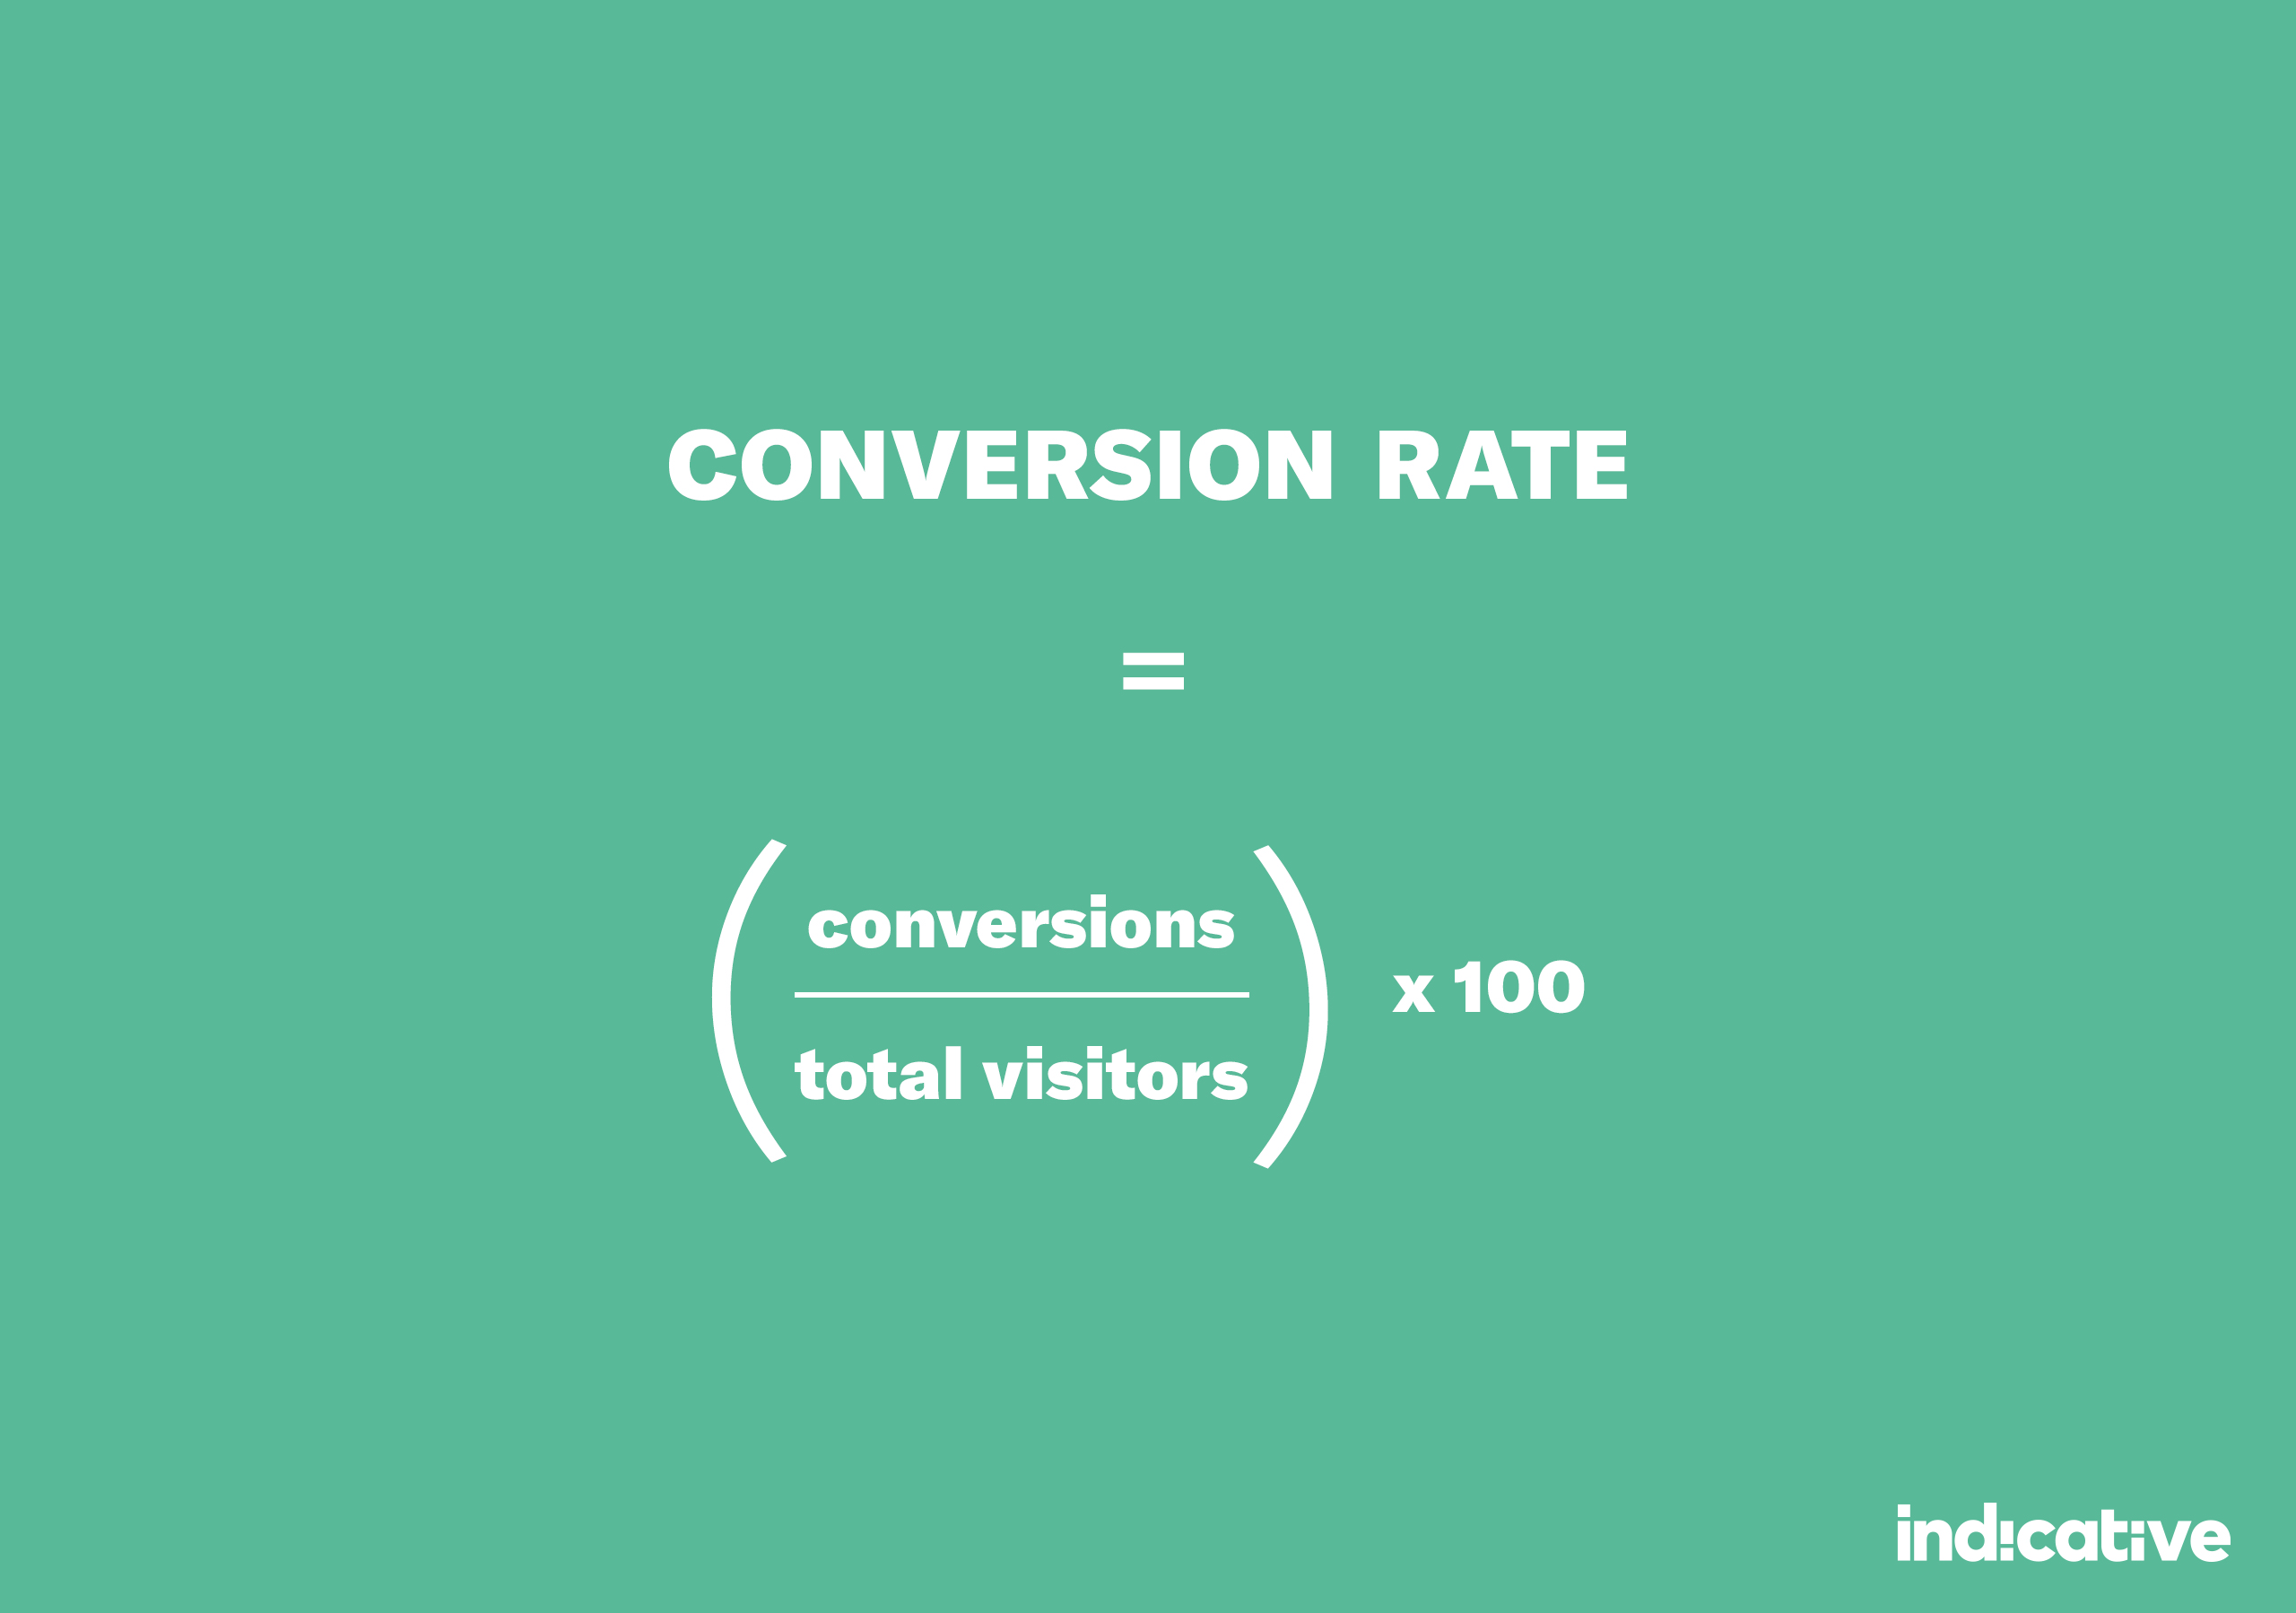
Conversion rate is the percentage of total visitors who convert. What constitutes a “conversion” is flexible. You can measure the rate of website visitors who convert to customers, for example, or the percentage of free users who convert to paid.
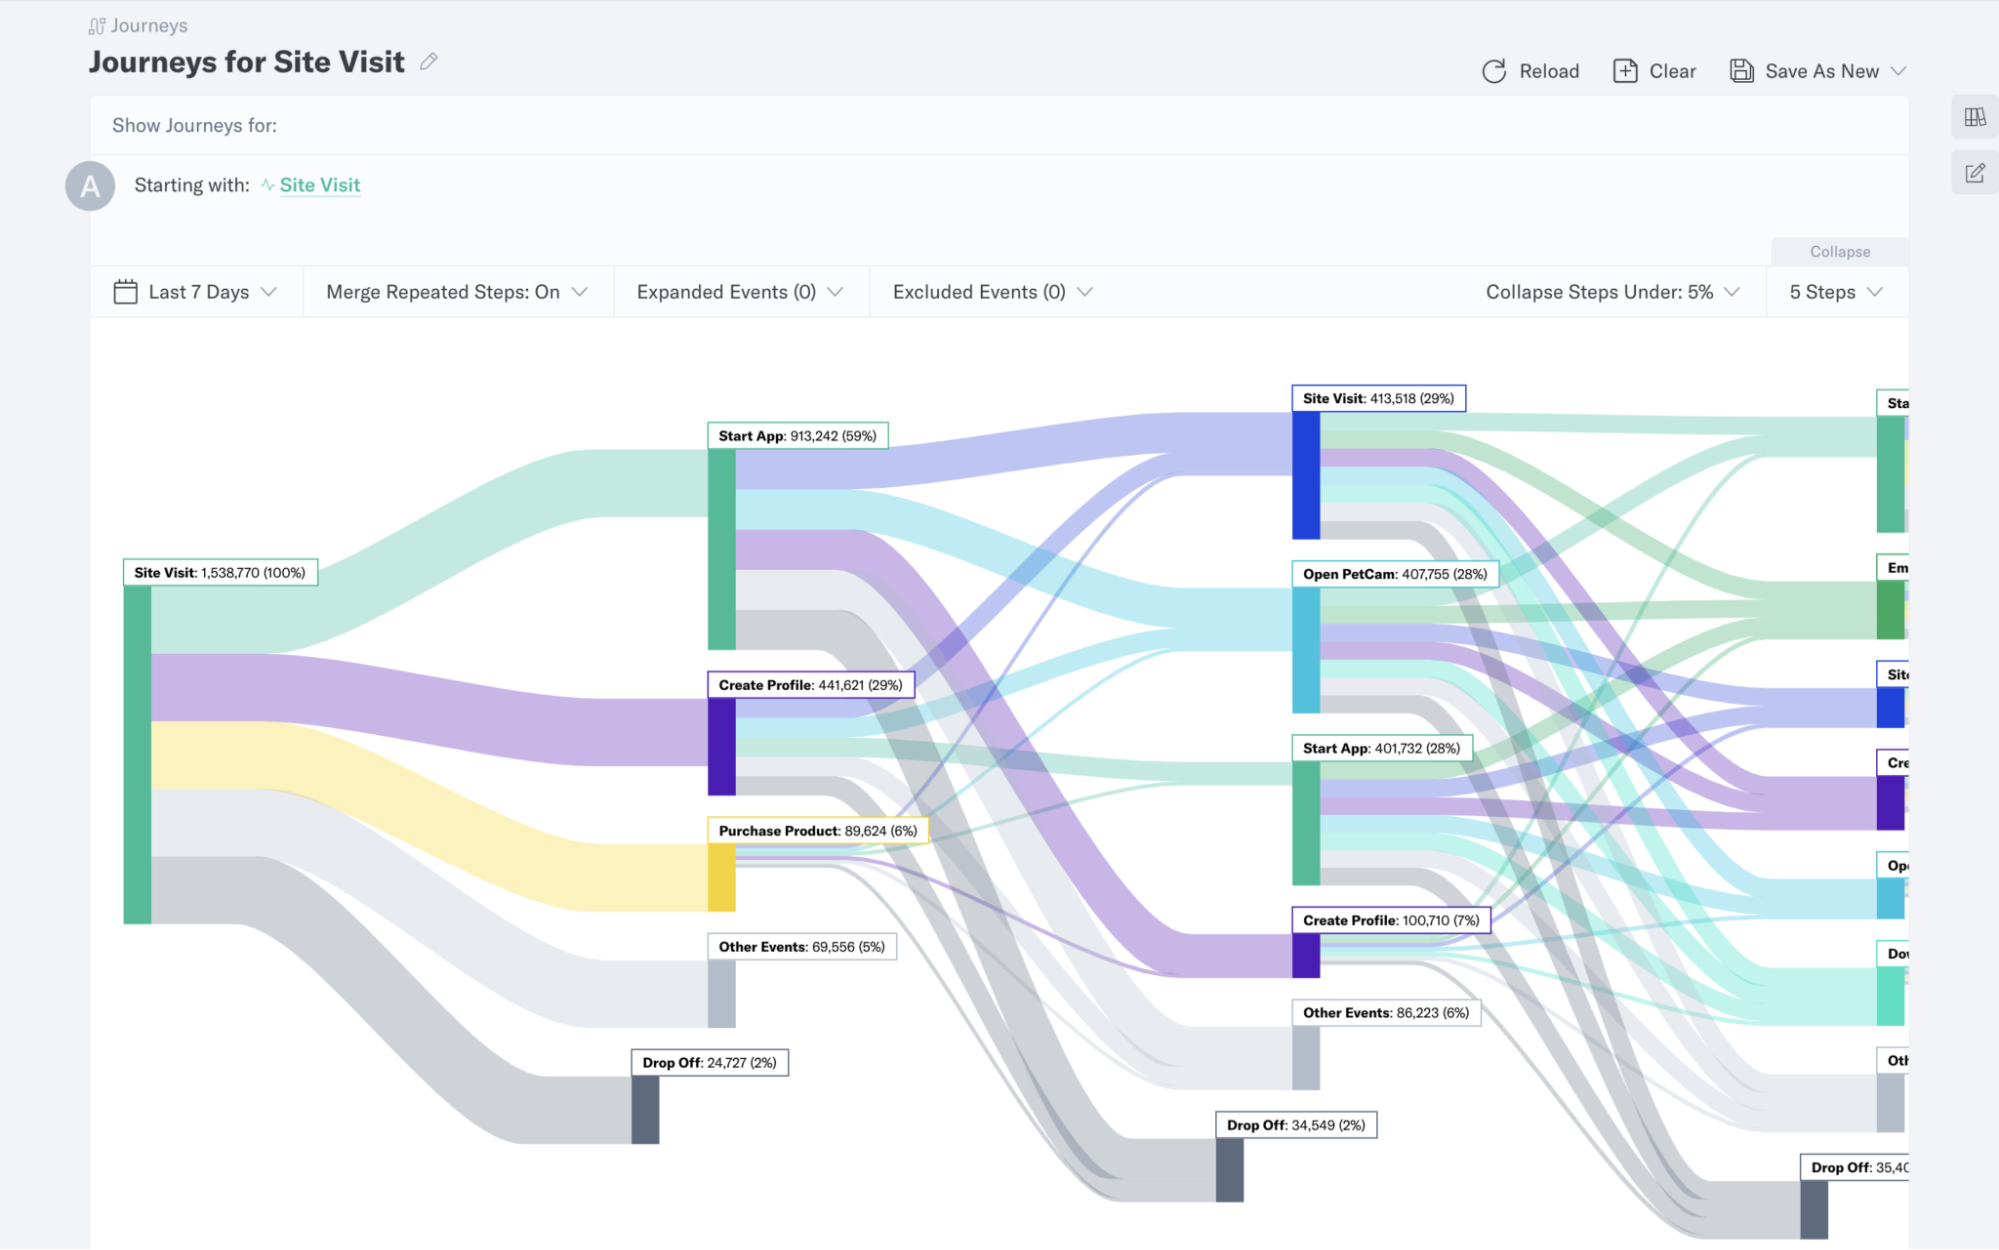
If you use a Product Analytics tool, you can get really granular here. Using the Multipath Funnel tool in Indicative, you can compare conversion rates for different customer journeys and see how rates change with or without any given step.
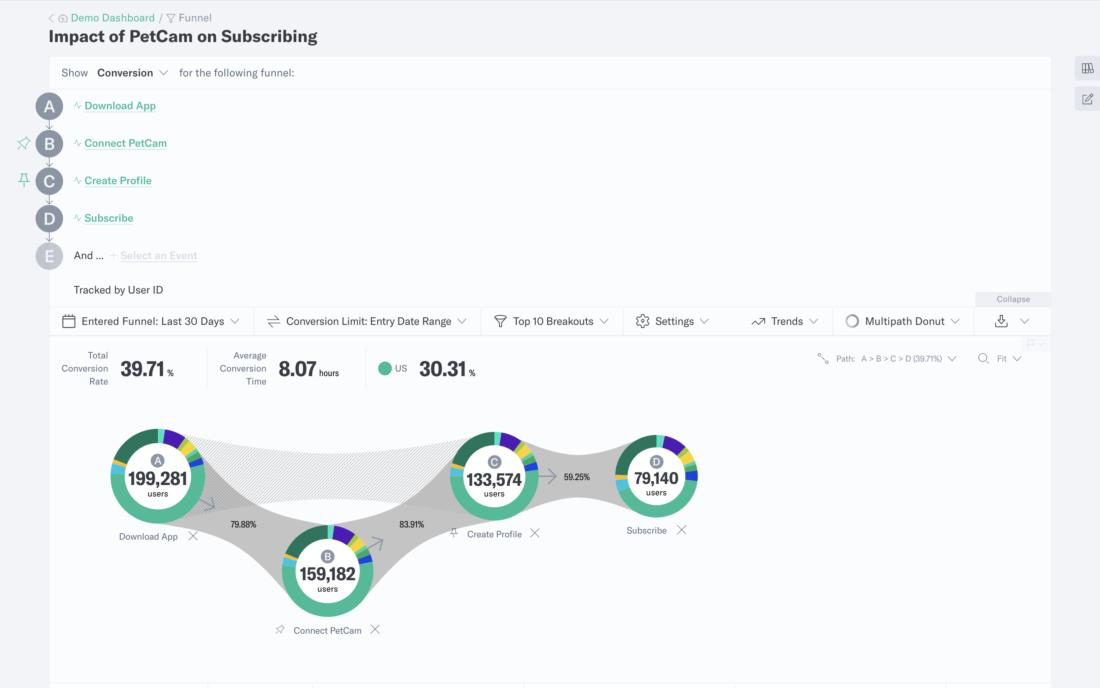
You can easily identify the path that leads to the highest product adoption, then target your efforts to funnel more users along that path.
For example: one of our customers—an online book retailer—wanted to know how their wishlist feature impacts the checkout flow. Using the Multipath Funnel, they analyzed conversion rates with and without a visit to the wishlist.
If they find that visiting the wishlist improves conversion rates, they can take steps to push more users to view the wishlist, like creating on-site nudges or adding more calls-to-action.
Time to value
Time to value (TTV) measures how much time passes between a customer’s first usage of your product and their “Aha!” moment or activation event.
While there’s no set formula for measuring TTV (since you’ll need to define your own “tipping point” for activation), it’s vital to measure because users who never reach that point may churn.
Product Analytics tools can help analyze your best customers and unearth the tipping point that led them to regular usage. You can segment users by lifetime value or engagement, for example, to find common events among your most valuable, engaged customers.
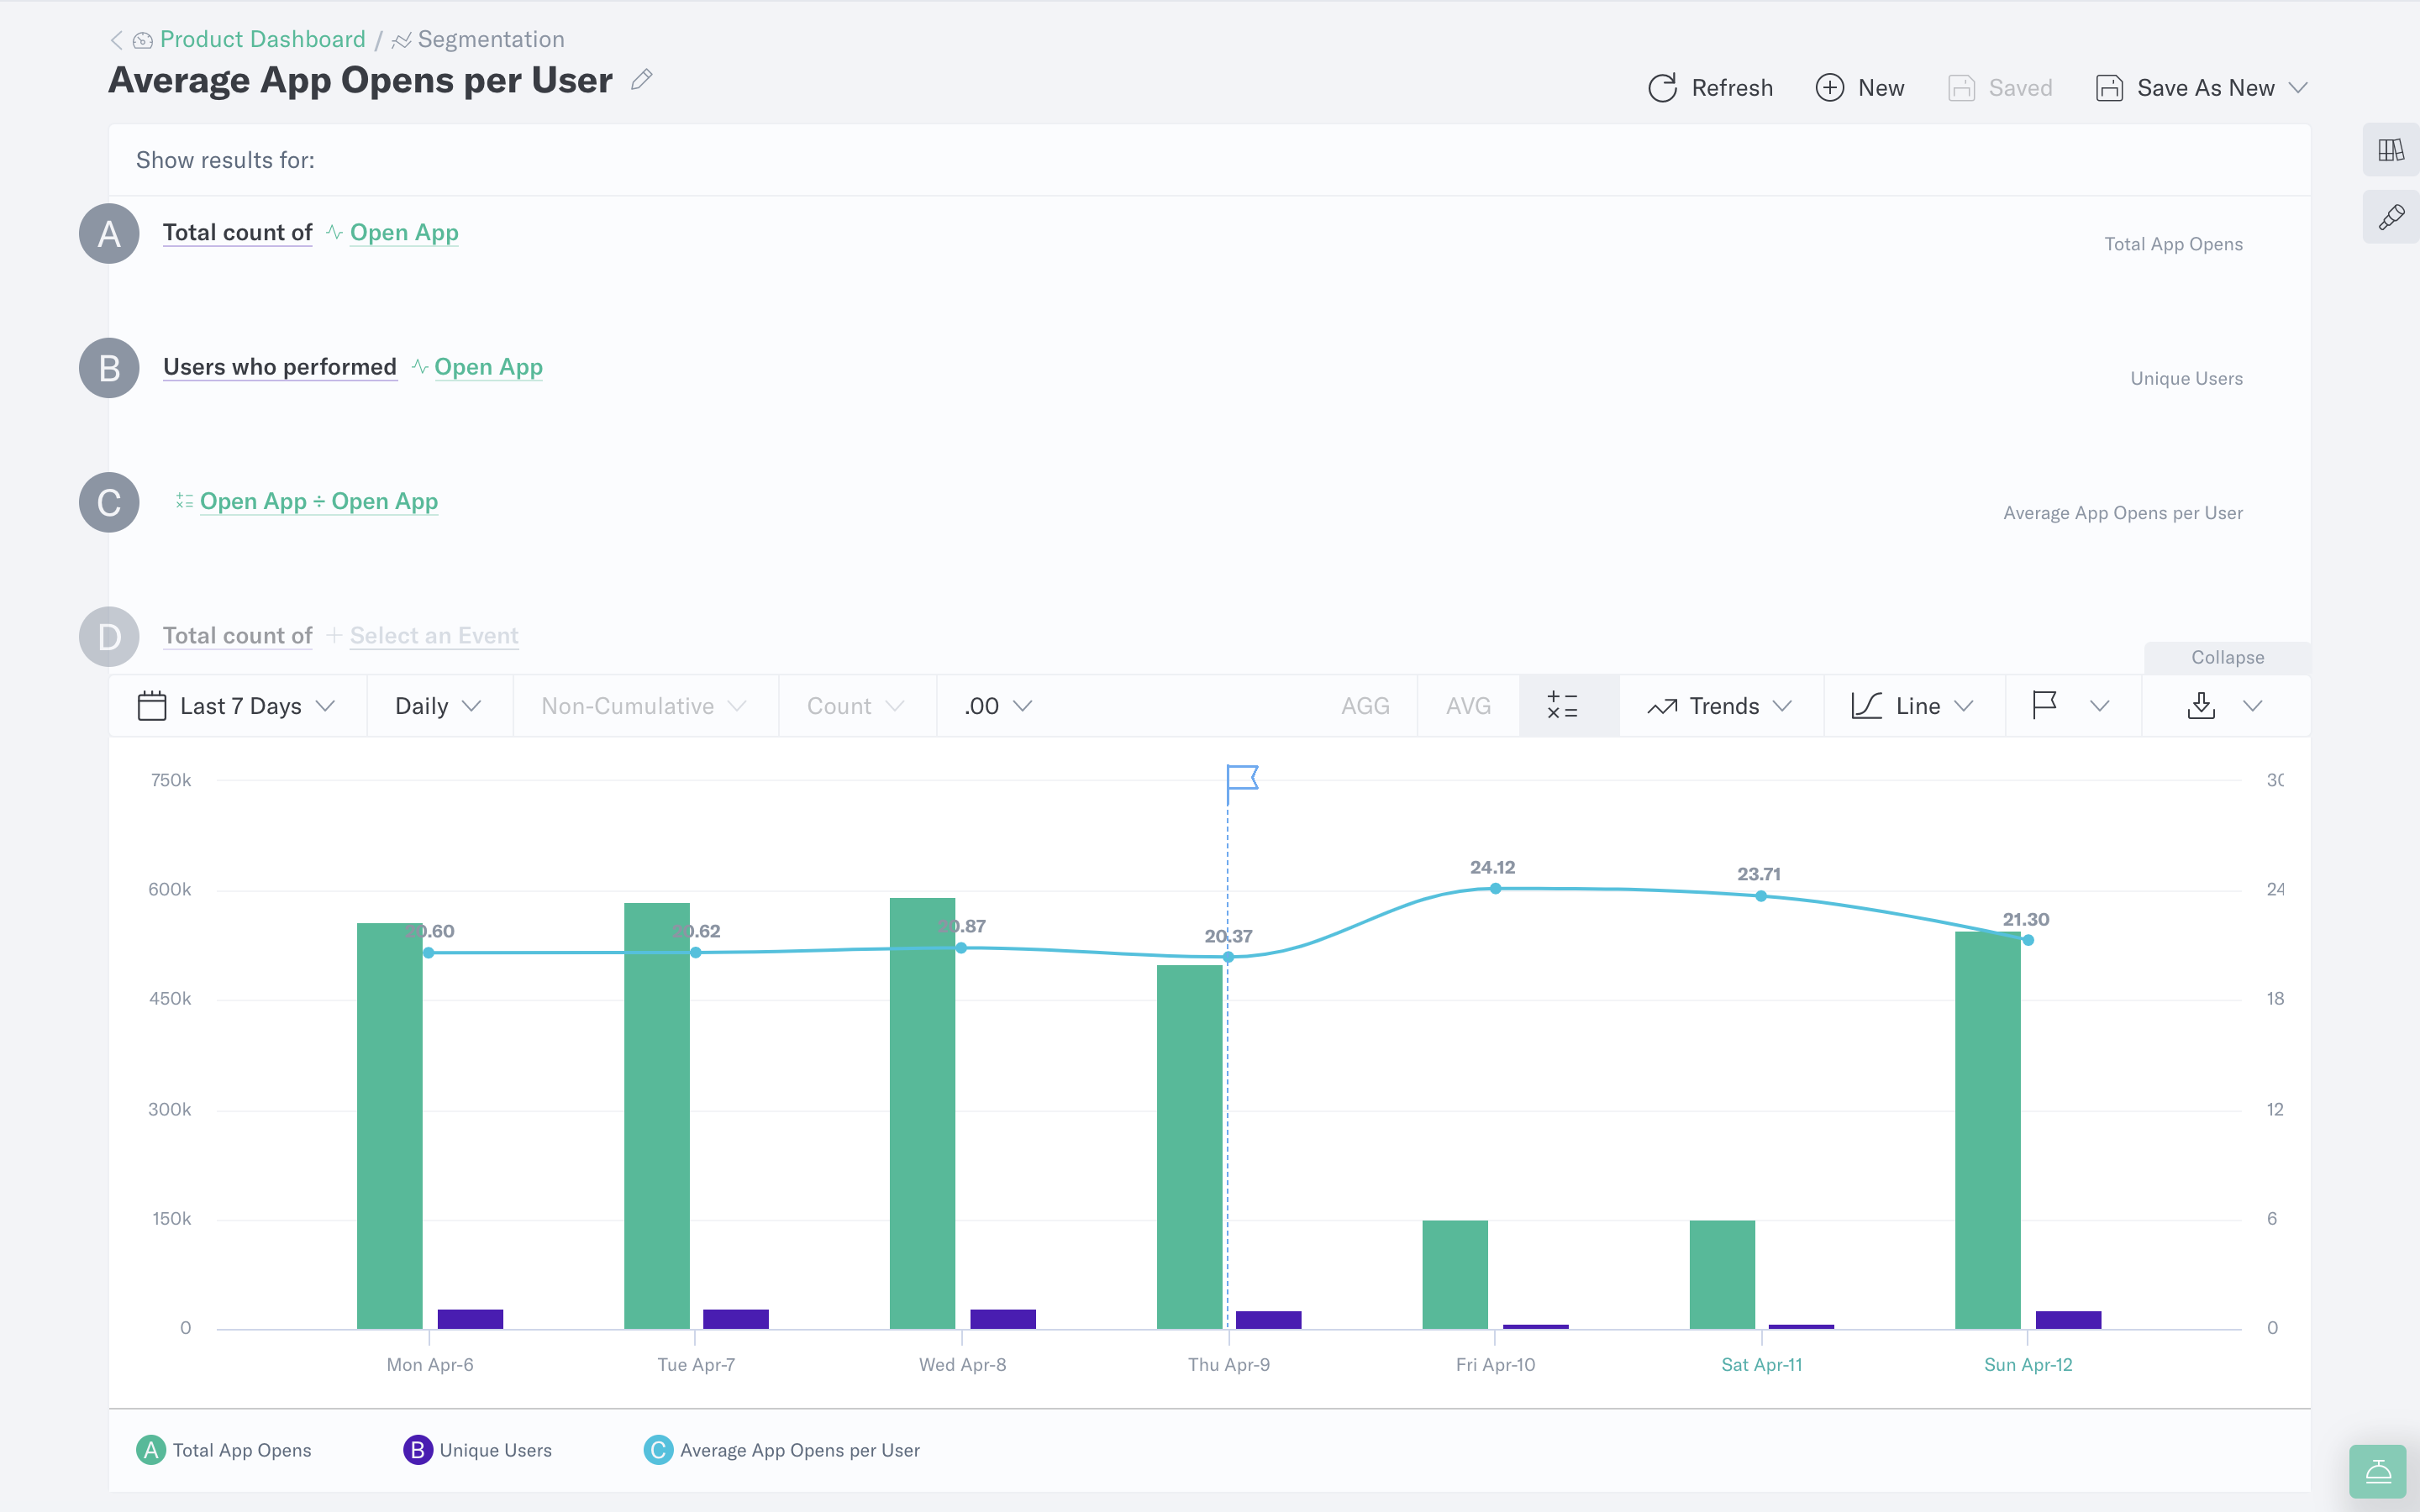
Usage frequency
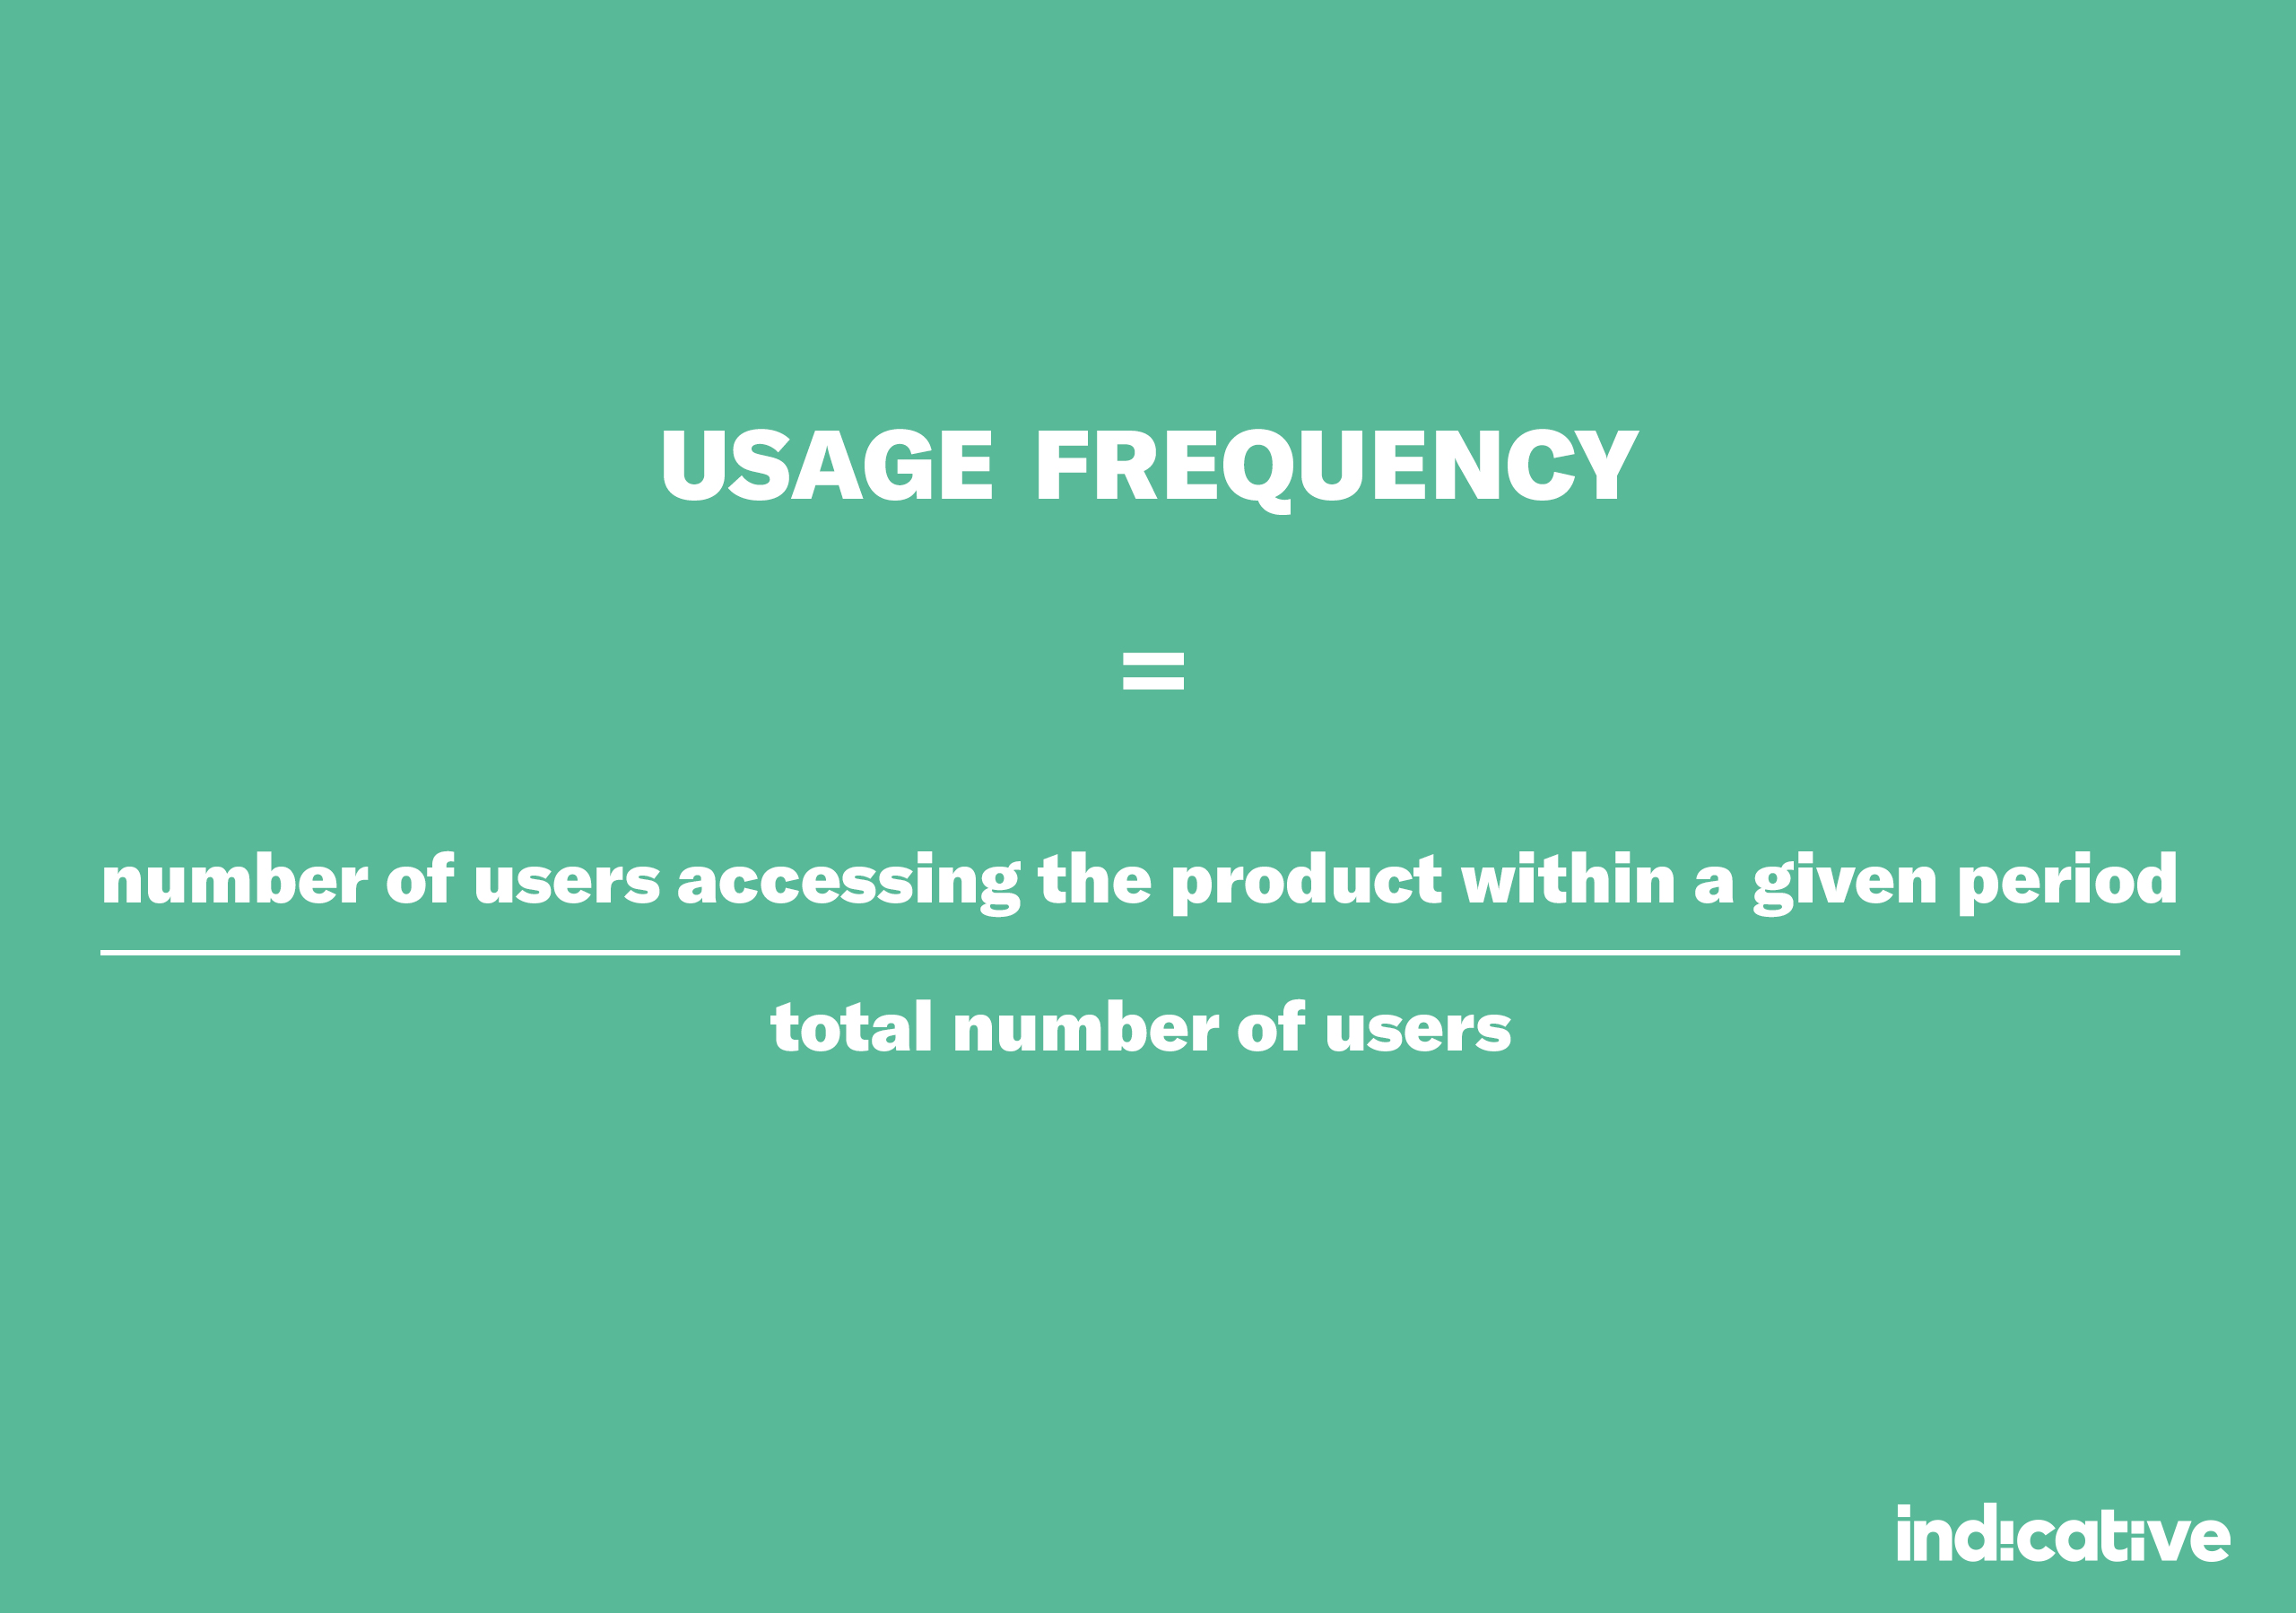
Usage frequency is similar to active users, but expressed as a percentage of your total user base. Generally, the more often people use your app, the better.
You can calculate usage frequency across the whole product and for specific features. If you use a Product Analytics tool like Indicative, you can also analyze how usage frequency varies over time and across different segments and cohorts of users.
That level of detail can help:
- Identify points of friction stopping users from more frequent usage
- Determine whether onboarding efforts are effectively educating users to get the most out of the product
- Funnel support toward users at risk of churning
Take Coupon Follow—a B2C coupon finding plugin—for example. The team wanted to know how many times per day their members view a coupon list.
With Indicative, they can analyze how usage changes across customer segments or personas, how it correlates with retention, and more.
If they find that usage frequency of three or more coupon list views per day leads to higher retention, they can add nudges to encourage users to view their coupon list more frequently.
How to Manage Churn via Retention Analysis
Users who fully adopt your product are far less likely to churn, so monitoring product adoption and working to improve it is a proactive way to reduce churn.
To do that, you need to look at adoption and retention side-by-side to see how specific adoption metrics—like usage of a particular feature or time to value—affect retention.
With Cohort Analysis, you can analyze customers with high LTV and retention rates to uncover common characteristics and use cases among them, and identify which features they use and how frequently.
For example, one of our customers uses Indicative to figure out which impression type leads to the highest 3-day retention rate, helping them better allocate marketing spend.
Using customer journey analysis, you can uncover the path those users follow—the campaigns they see, the steps they take, whether they complete your onboarding flow, and more.
You can follow the same process for low retention customers to identify at-risk behaviors for churn.
What you learn from retention analysis can help:
- Find your ideal customers and target more of them
- Define your activation event
- Improve onboarding and support
- Funnel users toward features that increase retention
- Create nudges and additional support for users at risk of churning
How to Increase the Rate of Product Adoption?
Let’s talk about how to get more users to fully adopt. Driving adoption is all about making the process as effortless as possible for users, then nudging them further along the path to adoption.
How to Drive User Adoption
As we’ve mentioned, adoption looks different for every organization. Still, there are steps every team can take to drive higher adoption:
- Build for adoption from day one by making your product as simple and easy-to-use as possible
- Target more of your best customers by doubling-down on the channels and campaigns that convert them
- Make engagement and re-engagement campaigns an ongoing priority
- Use what you’ve learned about adoption to improve onboarding and support so they can help speed up adoption and reduce friction (more on that next!)
How to Improve Your Onboarding Experience
Onboarding is a fundamental part of driving adoption. Here’s how to do it better:
- Use contextual onboarding to walk users through the onboarding flow from within the product, rather than having a separate help guide or video that takes users out of the app
- Focus your onboarding on driving users to the activation point
- Segment and personalize onboarding based on customer personas
- Solicit user feedback on how you can improve your onboarding flow
How to Improve Product Support
Customer support plays a vital role in increasing adoption. Consider this excerpt from one of our G2 reviews:
Their support team has multiple account managers that specialize in helping you understand the data and get your account set up so everything is easy to use without needing the support of their team to make every little change.
Investing in support early on can help you get more users to adopt, faster. It also lessens the burden on your support team down the road.
- Focus on hand-holding users through the first few steps, preparing them to become active users
- Balance self-service resources with real-time human support—users can help themselves with simple issues, and your support team can focus on more complex problems
- Track at-risk behaviors and prioritize support for users in danger of churning
How to Use Data to Improve Your Product
When you measure product adoption using Product Analytics, you have a ton of data at your fingertips to help improve your product and adoption rate.

To put that data to work is an ongoing process—a continuous loop where you:
- Analyze the data and develop a hypothesis for how to increase adoption
- Improve or update the product accordingly
- Validate your results
Here’s an example of how that framework plays out:
At Indicative, we originally thought our “Aha!” moment related to query-building. But after analyzing our data via Multipath Funnel and Cohort Analysis, we found usage of share-ability features (like dashboards) had a bigger effect on adoption.
Turns out, sharing data was our activation event, and knowing that has driven a lot of our product development.
With customer data and the right Product Analytics solution, you can:
- Use customer journey analysis to identify your own “Aha!” moment
- Compare retention over time across different customer groups to find trends among those who fully adopt the product
- Formulate a hypothesis for improving adoption
- A/B test and measure your adoption rate over time to validate
Note: Check out our full guide and webinar on using data to build a product that drives adoption.
Ideal Tools From Your Stack That Help
Data is a core element in measuring and increasing adoption, so you need the right tools in place to collect, analyze, and operationalize it. While your tech stack likely includes much more, these are the baseline solutions you’ll need.
Your Data Stack
Your data and analytics stack needs (at least) three layers:
- Ingestion
- Storage
- Analytics
You have a lot of options here, but some of the major players for event collection and ingestion include: Segment, Snowplow, mParticle, Tealium, FreshPaint, Rudderstack.
The storage layer in a modern data stack is usually a cloud data warehouse (CDW). Google BigQuery, Snowflake, and Amazon Redshift are among the most popular CDWs today.
The analytics layer may include many tools, but for our purposes here, the most important for measuring and increasing adoption is Product Analytics. Indicative is Product Analytics built for the modern data stack and the only Product Analytics solution that connects directly to your data warehouse.
Other Tools
Once your data stack is in place, you have all the information you need to understand how to improve product adoption. You’ll need some more tools to operationalize that plan.
How Prezi Improves Adoption With Product Analytics
Let’s look at a more in-depth example of how Prezi—a virtual and interactive presentation software and one of our customers used Product Analytics to improve adoption.
Case Study Example: Prezi
When Prezi launched a new virtual presentation and video product called Prezi Video, facilitating quick adoption among their users was a key challenge. The team wanted to see, in real-time, whether users adopted the new feature, how they used it, and which power users might offer more insight.
They used the Multipath Funnel tool in Indicative to map out how they wanted users to move through the new product, including the activation event. They kept an eye on those flows—along with real-time dashboards—in the days and weeks following the launch.
Through those funnels, the team measured how many of their users adopted Prezi Video. They could also see where other users diverged from the path, identifying and fixing points of friction that slowed or stood in the way of adoption.
Note: You can read the full Prezi case study here.
Product Analytics to Power Your Product Adoption
Check out our public demo to start increasing your product adoption today.

 Indicative Team

