
As customers navigate and interact with your website, they create an opportunity for you to measure and improve your marketing metrics with data. As a marketer, you can gain deep user insights from that data to optimize conversion, engagement, and retention.
These insights also allow you to observe how marketing campaigns are performing and reveal possible bottlenecks. Knowing what marketing metrics to track and fully understanding that data can feel like a daunting task. Not to mention, once you do figure out which metrics to track, you have to then extract insights to make it actionable.
We’ve compiled a list of the top 15 marketing metrics to track and explained how they can help you adopt a data-driven mindset to optimize your marketing campaigns.
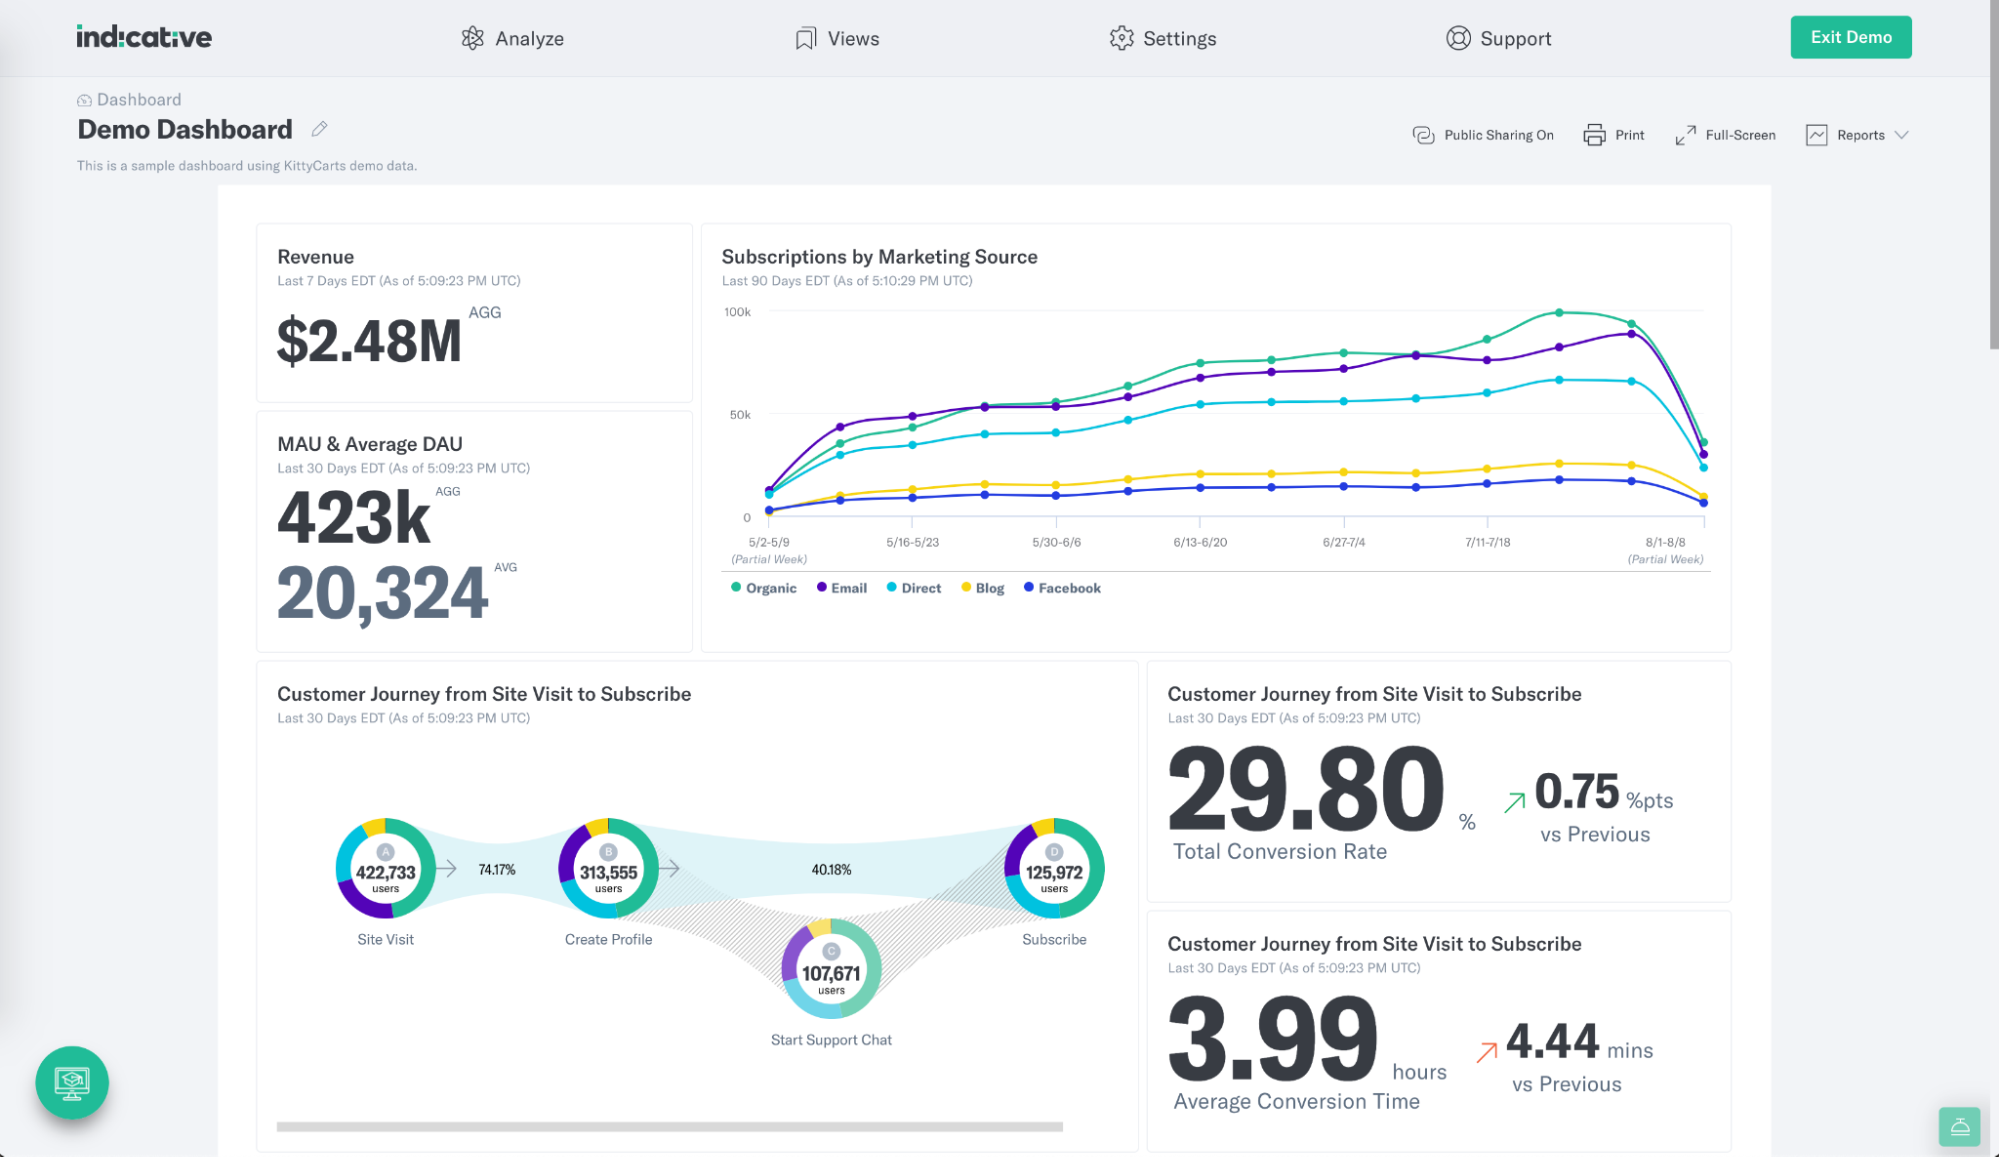
Marketing Dashboard in Indicative
Bounce Rate
Bounce Rate – which calculates how many times a user visits your website and leaves without any other interaction – can be tricky to evaluate. If your bounce rate is high on certain pages that are critical for conversions, like your homepage or product pages, then that may suggest something is not right and needs review.
A high bounce rate may signal that something’s awry, but that isn’t always the case. For an article or blog-based website, a high bounce rate could indicate that users found what they were looking for on that first page.
Either way, it’s critical to keep an eye on your bounce rate to monitor your conversion and ensure that your site is functioning properly.
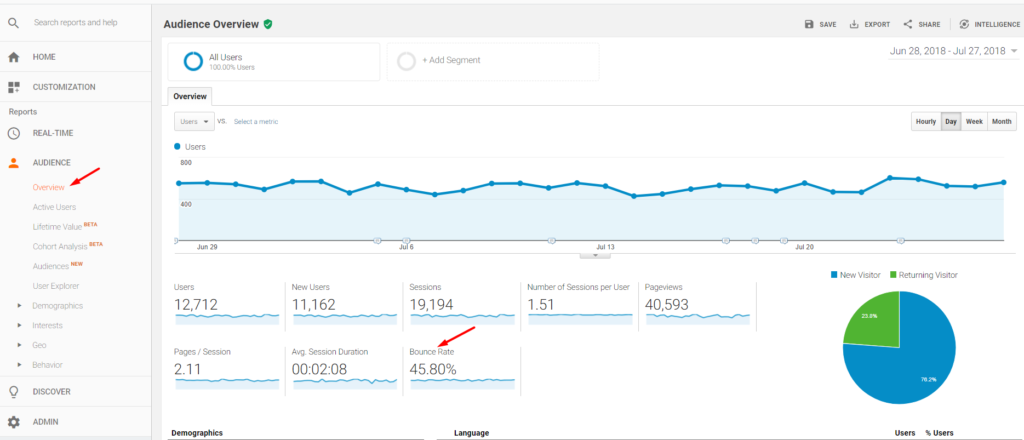
Bounce Rate in Google Analytics
Click-Through Rate
Click-through Rate (CTR) is the ratio of clicks on calls-to-action (CTA) to the number of leads who only view the page, email, or social media advertisement. Unlike shares, likes, or comments, CTAs are created to move leads deeper into your conversion funnel and to other pages on your website.
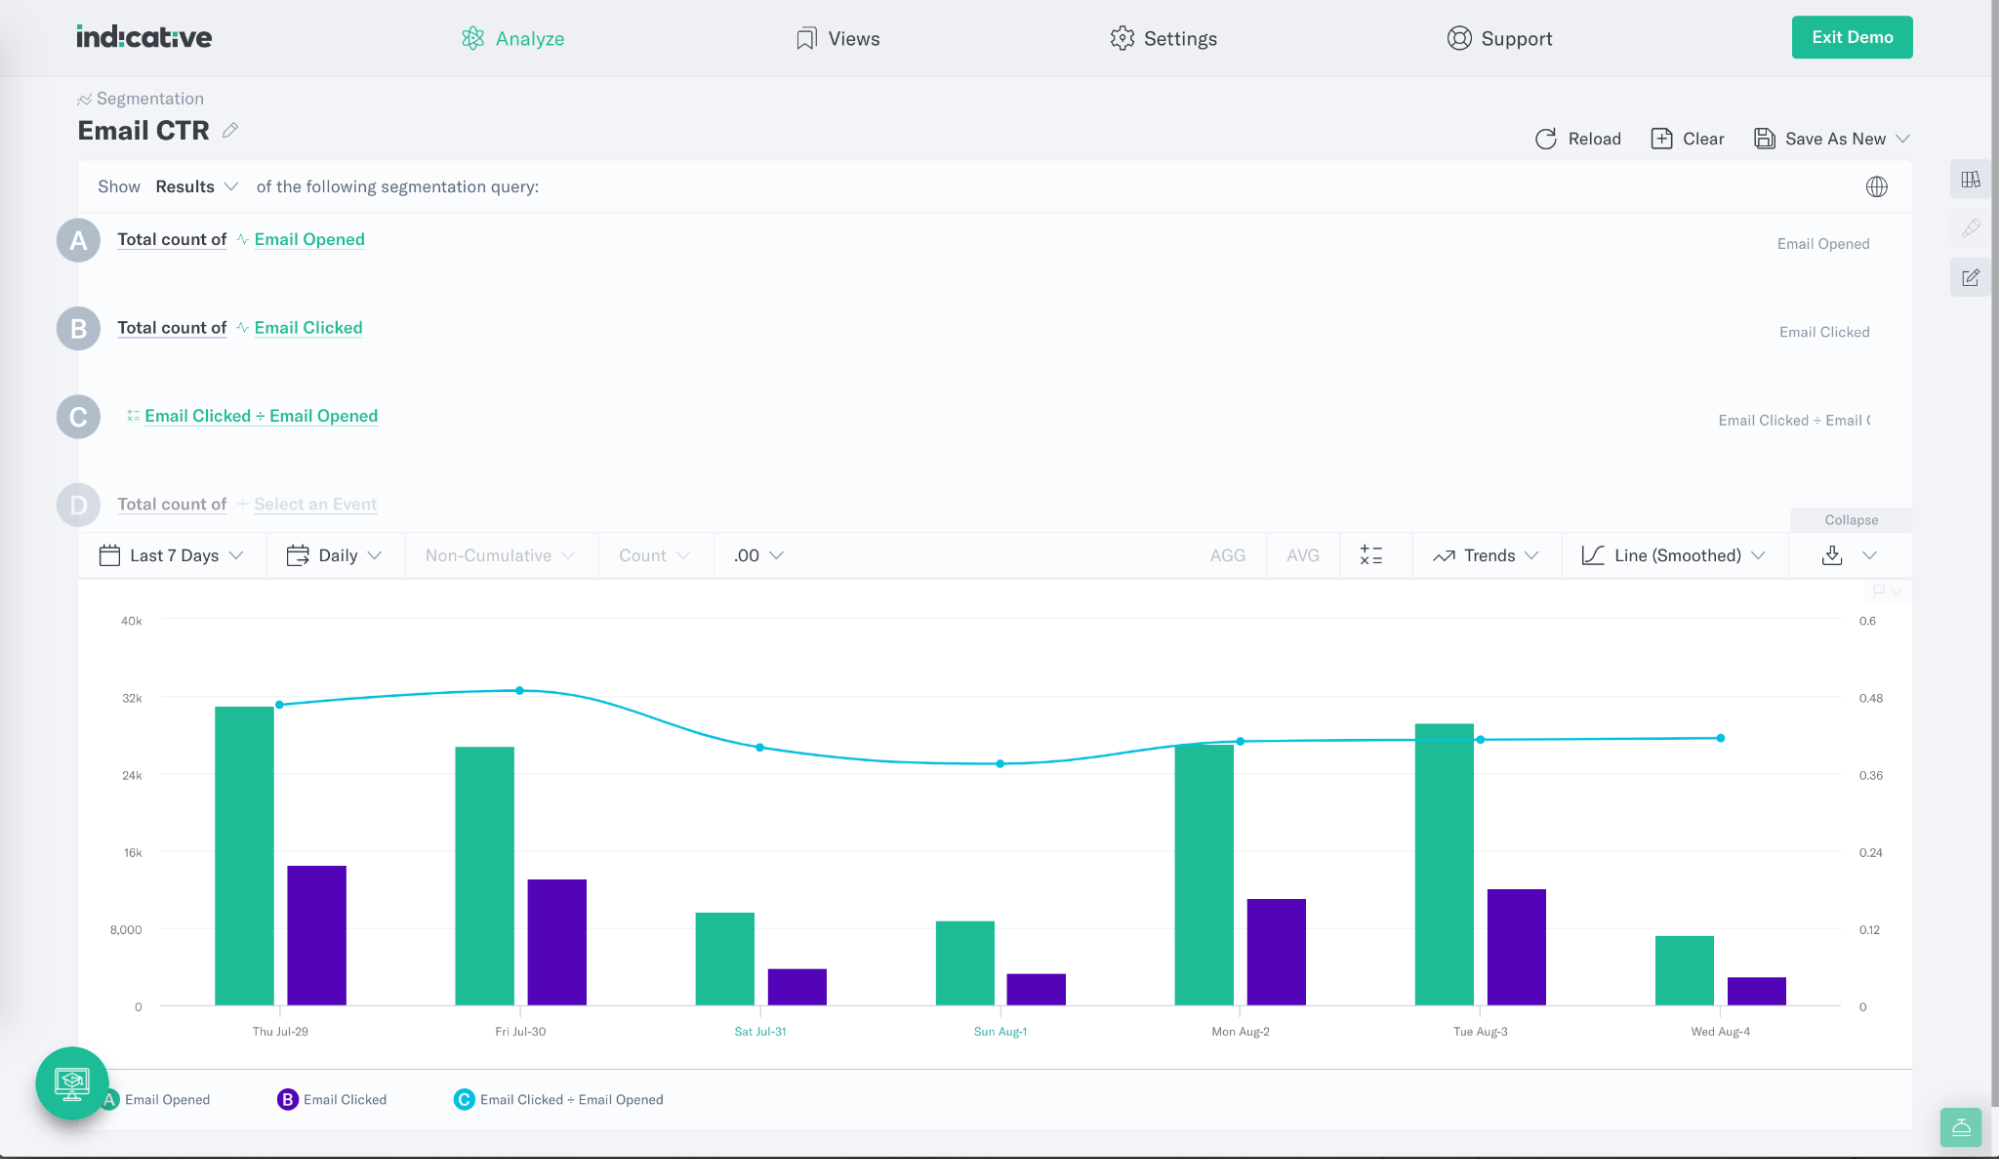
CTR in Indicative
Tracking your CTR is especially important when assessing the effectiveness of your CTAs. If your CTAs aren’t effective, it will show through tracking your CTR. Once a low CTR is identified, you can begin to reveal problems such as CTA placement and copy.
Session Time
Session time is the amount of time a user spends on your site. A user who spends a lot of time on your site, even if they never leave the initial landing page, can serve as a better estimate of site and digital marketing success than CTR alone.
Session time is a simple metric that offers a lot of insight into customer interest in your site and can help you identify user trends in your data.
If users aren’t spending enough time on your site to understand your product or make a purchase, that may be an indication of a confusing layout, lack of relevant content, or inaccurate marketing of the target audience.
Ultimately, session time can help you determine your content marketing strategy moving forward, identify potential issues and opportunities, and where to invest your budget.
Customer Engagement
Customer engagement is about creating interesting and relevant content that keeps customers engaged in meaningful ways to your business over time.
Tracking engagement gives you an opportunity to examine when and why customers drop out of your funnel, which initiatives are retaining customers, and the overall success of your site or app.
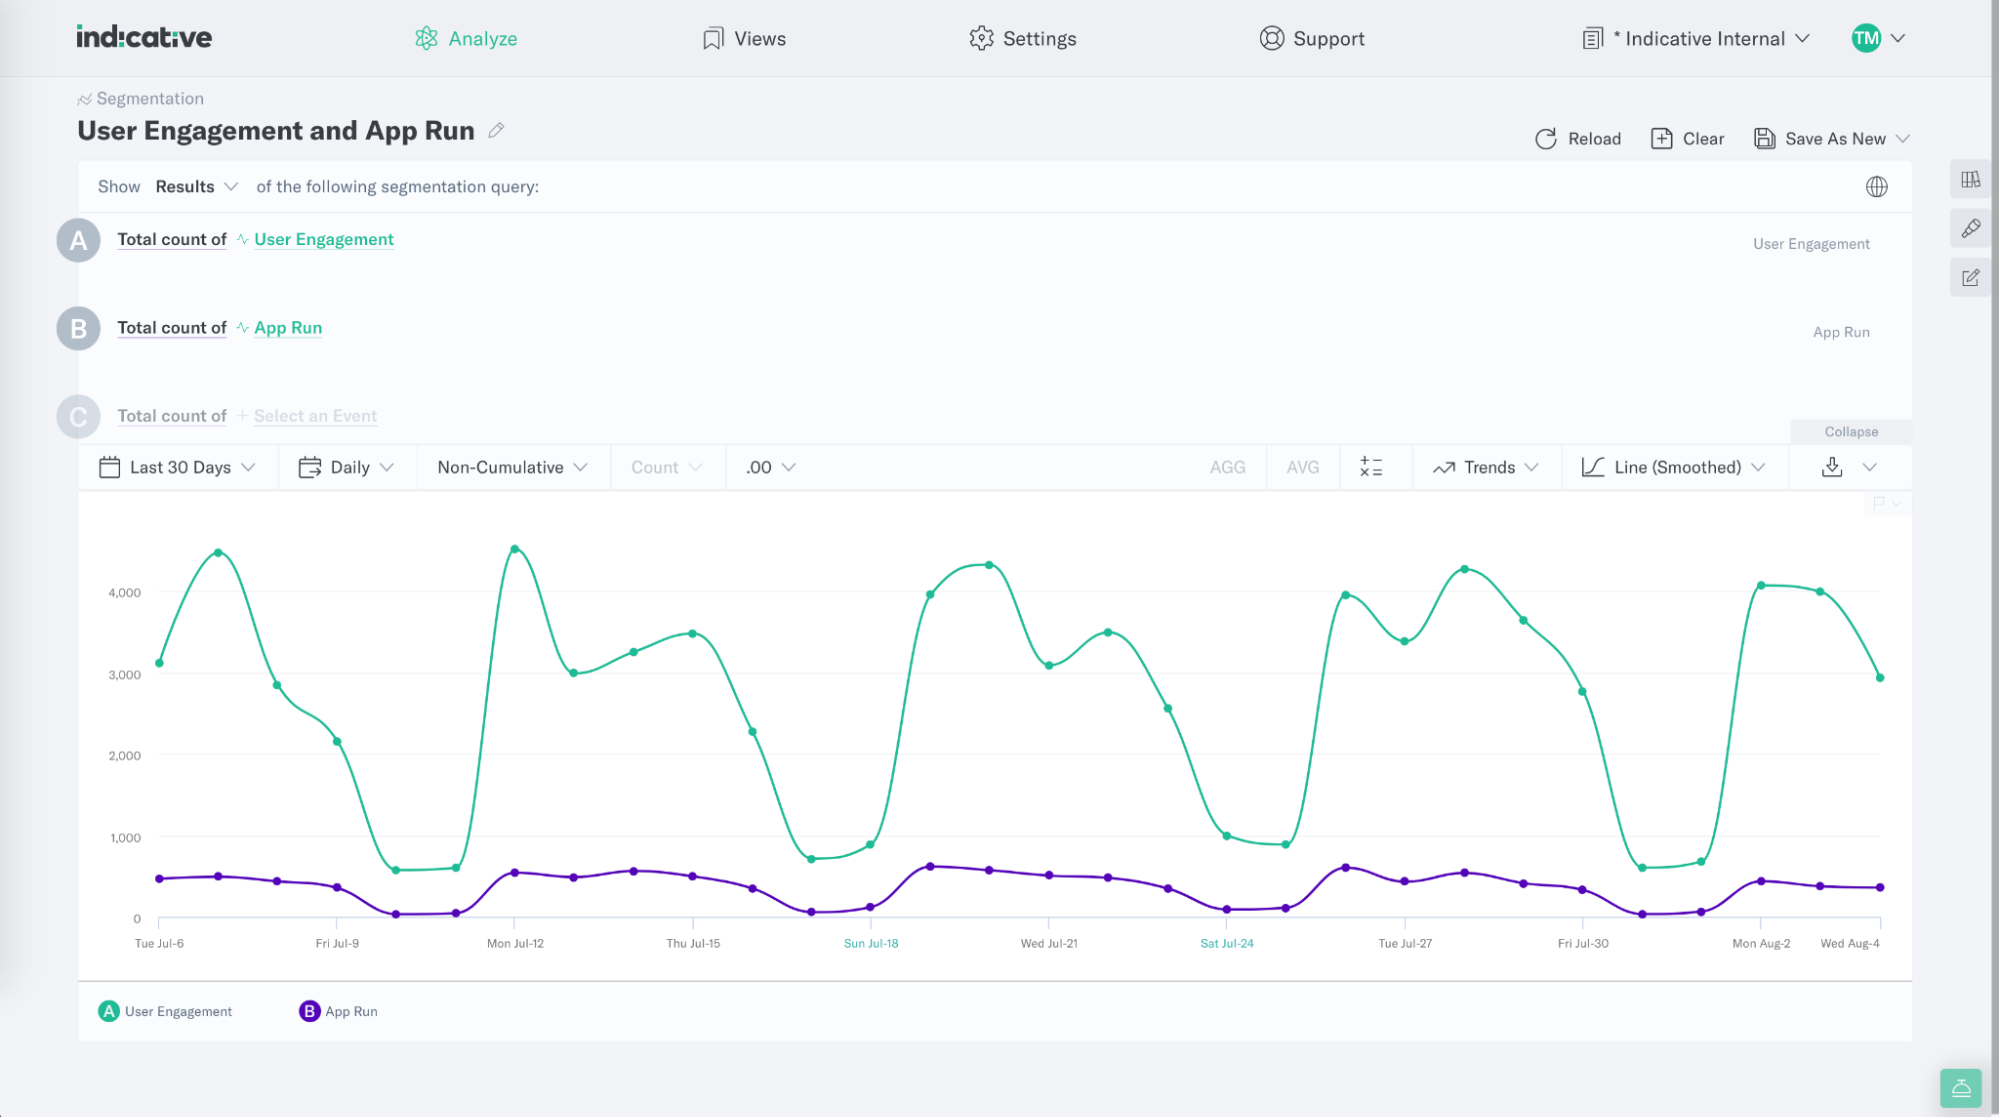
Engagement in Indicative
Customer engagement metrics can be as specific as how many premium articles customers read to as general as to how many times they open the app. Both are important in gauging your overall customer approval.
Multi-Channel Attribution
Multi-Channel Attribution is examining which of your marketing channels lead to and generate the most sales and then giving those channels the correct amount of credit based on its results within the given sales cycle.
Tracking your multi-channel attribution can give you insight into where your traffic is coming from, returning from, and converting from, across multiple marketing metrics.
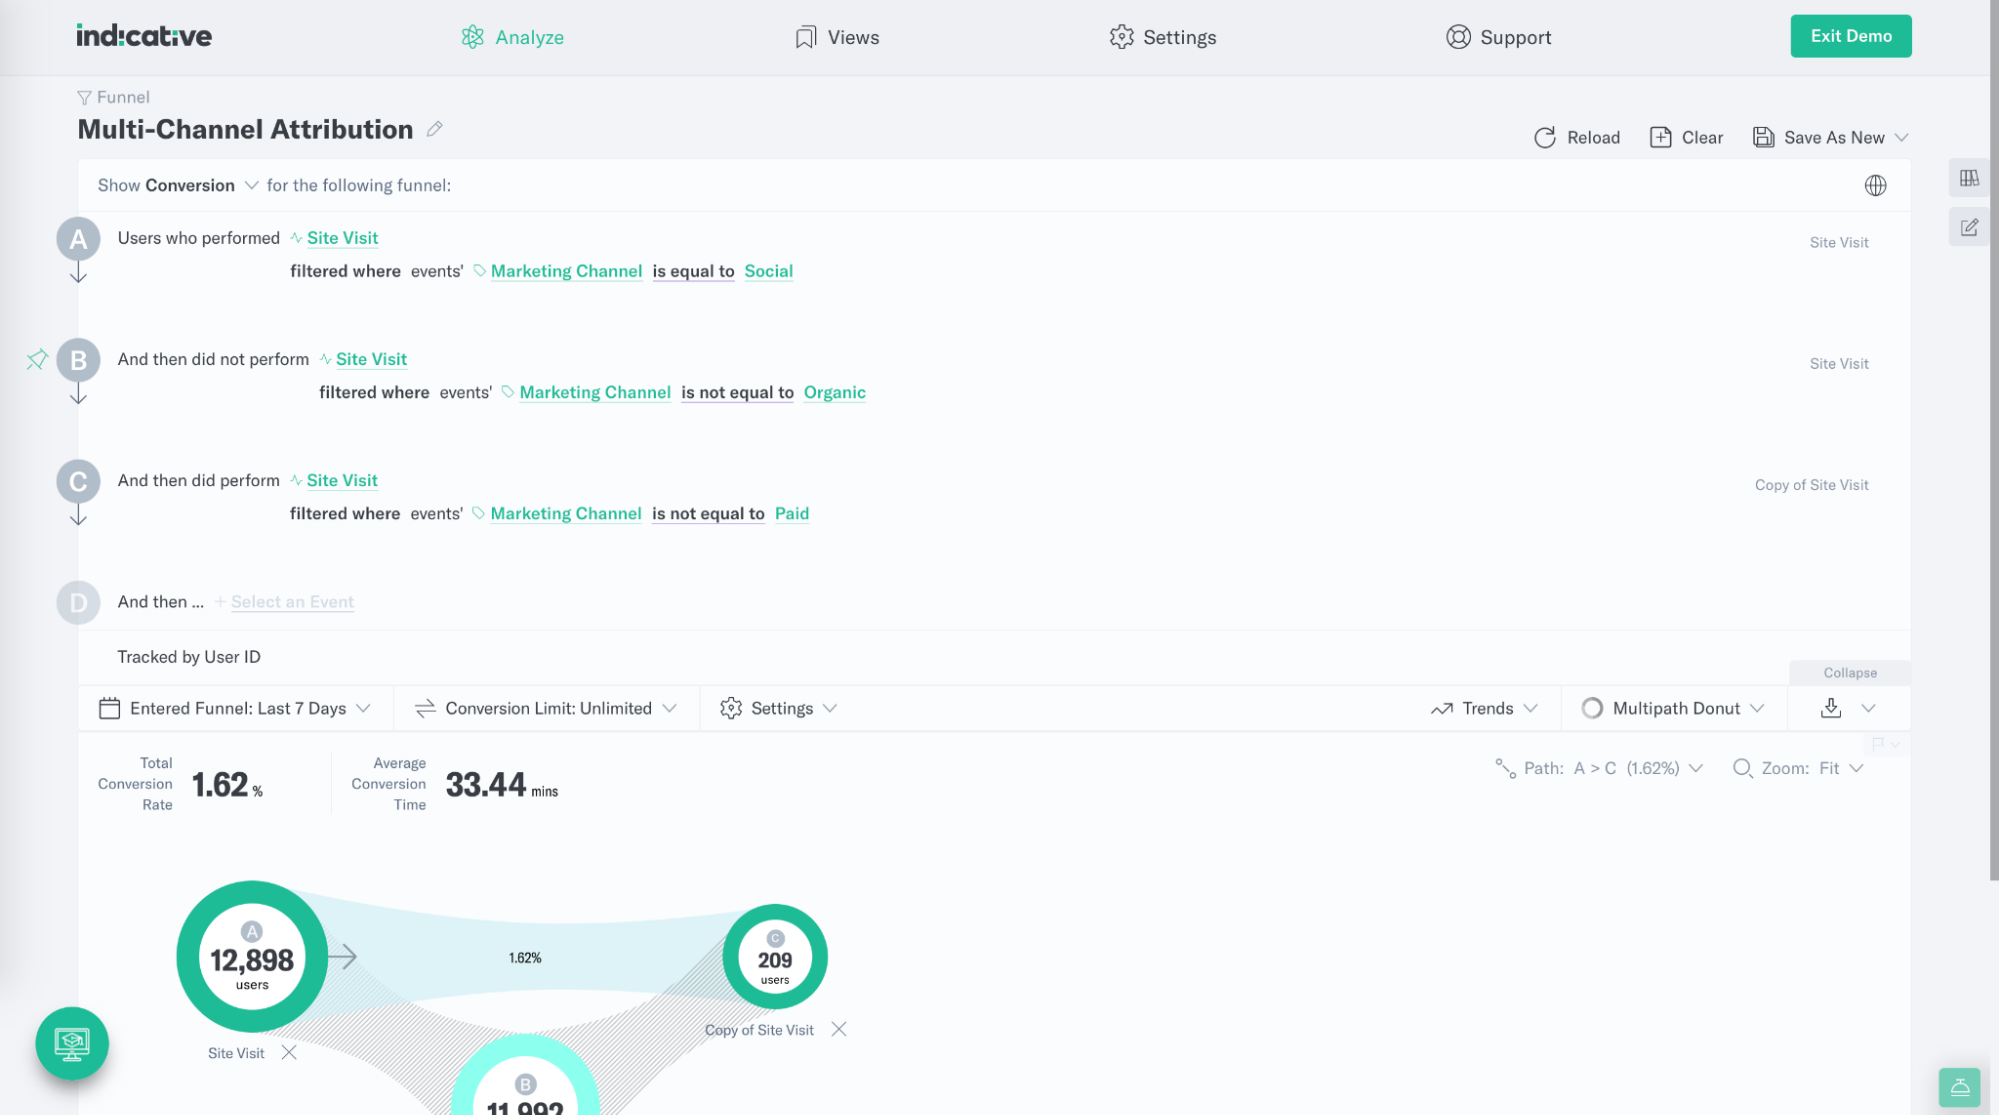
Multi-Channel Attribution in Indicative
By tracking this information, your business can also have a better idea of how much money to allocate to each marketing channel, making your budget more efficient and allowing you to understand where you should be optimizing your content.
Conversion Rate
Conversion rate represents how many customers complete a goal on your site, like creating an account or making a purchase, out of the total number of customers who visit your site.
This is an important marketing metric to track because it gives insight into the overall success of your site, social media account and/or app.
By improving your conversion, you can directly increase your sales, whether it’s a subscription or product purchase.
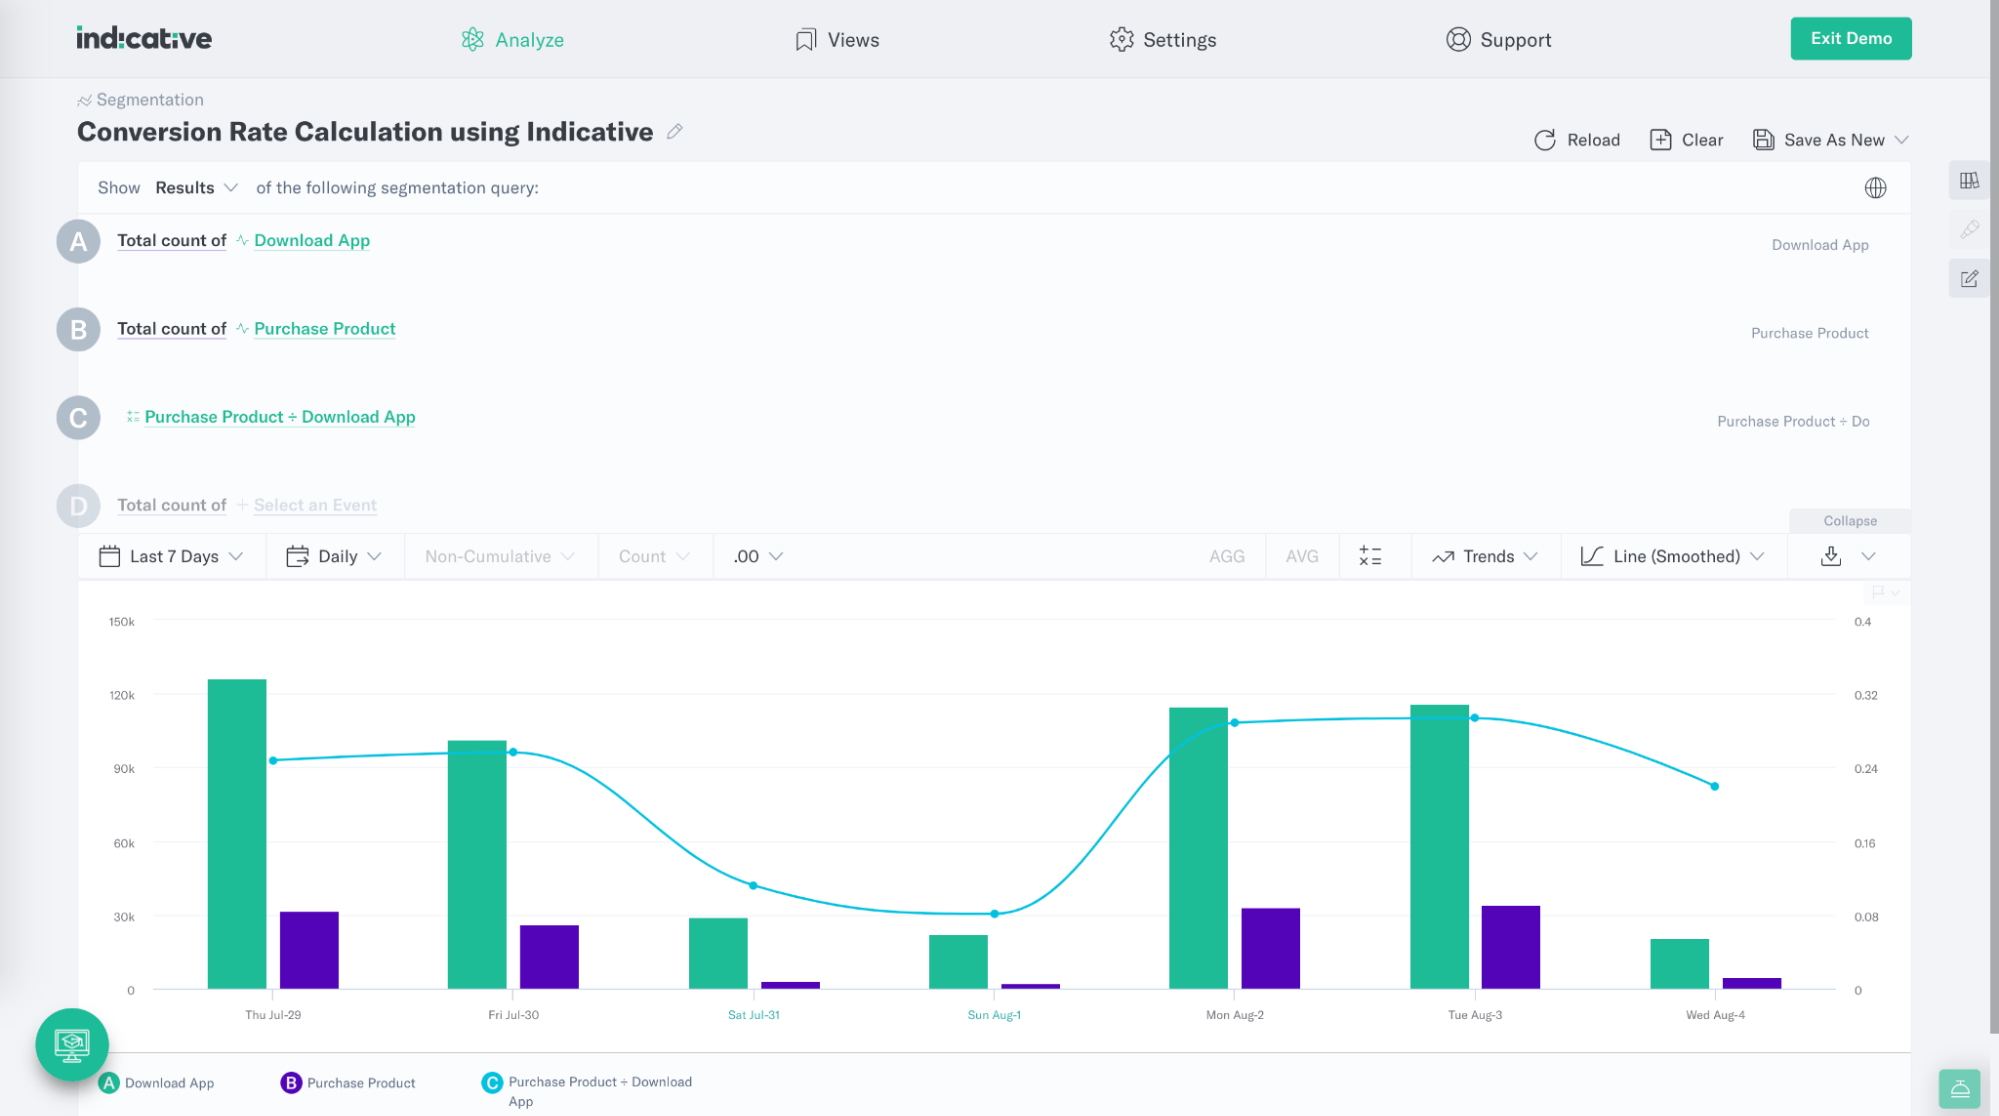
CVR in Indicative
Conversion Rate Optimization (CRO) refers to optimizing and calculating conversion rate and identifying goals. CRO includes identifying areas that can be changed, adding new features and enhancing current features. Improving your CRO can directly impact the success of your site, social media account and app.
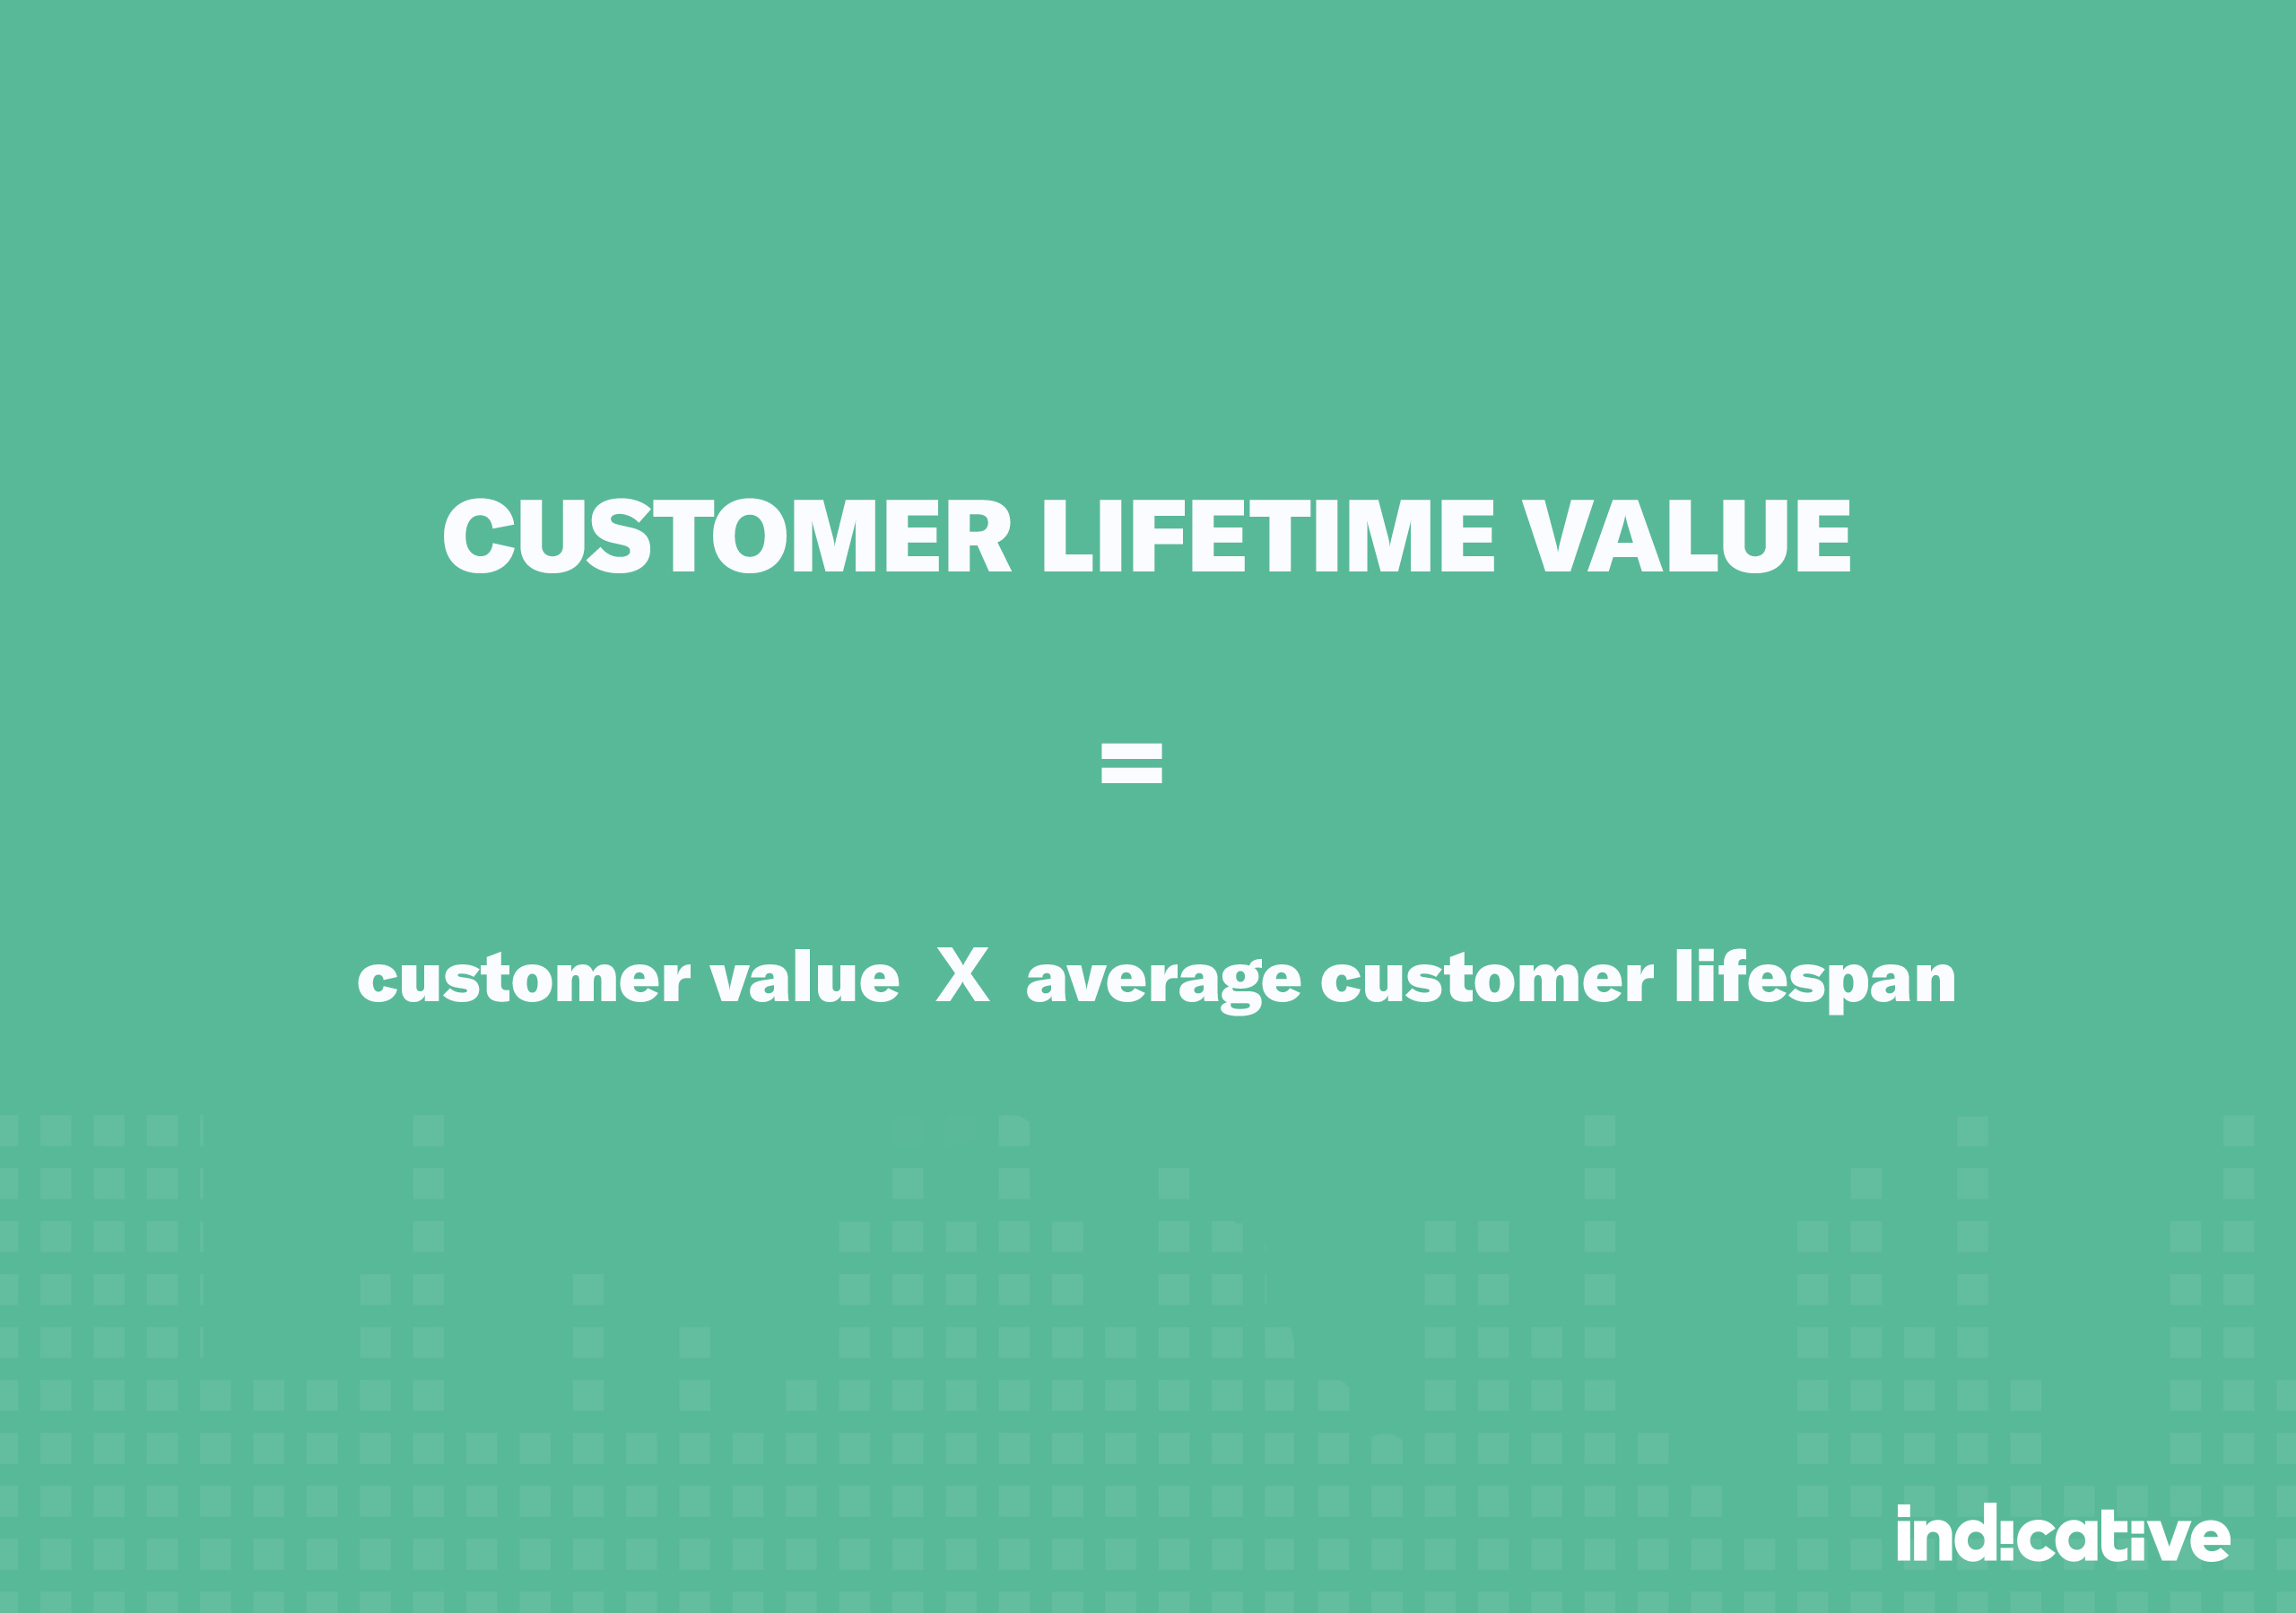
Customer Lifetime Value
Customer Lifetime Value is the expected revenue and value a customer will bring to your organization over the course of their life. By looking at your customer lifetime value, you can gain insights into how valued your product is to customers.
This is an important metric to track because it indicates whether marketing campaigns are efficiently demonstrating consistent value to your customers. If your customer lifetime value significantly drops, you can easily conclude that a given marketing campaign is not efficient and it may be time to turn to a retargeted content marketing strategy.
Customer Lifetime Value (CLTV) Formula
MQL to SQL Conversion Rate
A successful marketing campaign can be measured by the number of Marketing and Sales qualified leads that enter your conversion funnel. Marketing qualified leads are generally middle and bottom of the funnel leads that have demonstrated interest in your brand or product, but not yet fully qualified for sales. Sales qualified leads are potential customers that have shown clear buying-intent and are directed to sales teams for further qualification via BANT criteria, and possibly conversion.
By tracking the MQLs to SQLs conversion rate, you can identify which marketing campaigns bring in the most qualified leads and drive conversion in your funnel. In addition, a high MQLs to SQLs conversion rate means that marketing and sales teams are working efficiently together to bring in qualified leads that will convert.
Website Traffic Sources
Monitoring which website traffic sources are bringing in leads and driving conversion can help you and your team identify points of friction in customer experiences. Main website traffic sources such as direct, referral and search indicate which marketing campaigns lead to more customer engagement.
By understanding the sourcing of your leads, you can understand which aspects of your products and customer experiences are most likely to drive conversion and minimize disengagement.
Social Media Engagement
With the coming of the digital transformation, new digital marketing channels, such as social media, are replacing traditional ones. Social media engagement not only measures your following but more importantly how they engage with your product.
Engagement ranges from shares, likes, and comments — each of which demonstrate how your digital marketing strategy is impacting potential leads and user engagement levels. This is an important metric to track because it measures how effective your social media campaigns are at driving conversions.
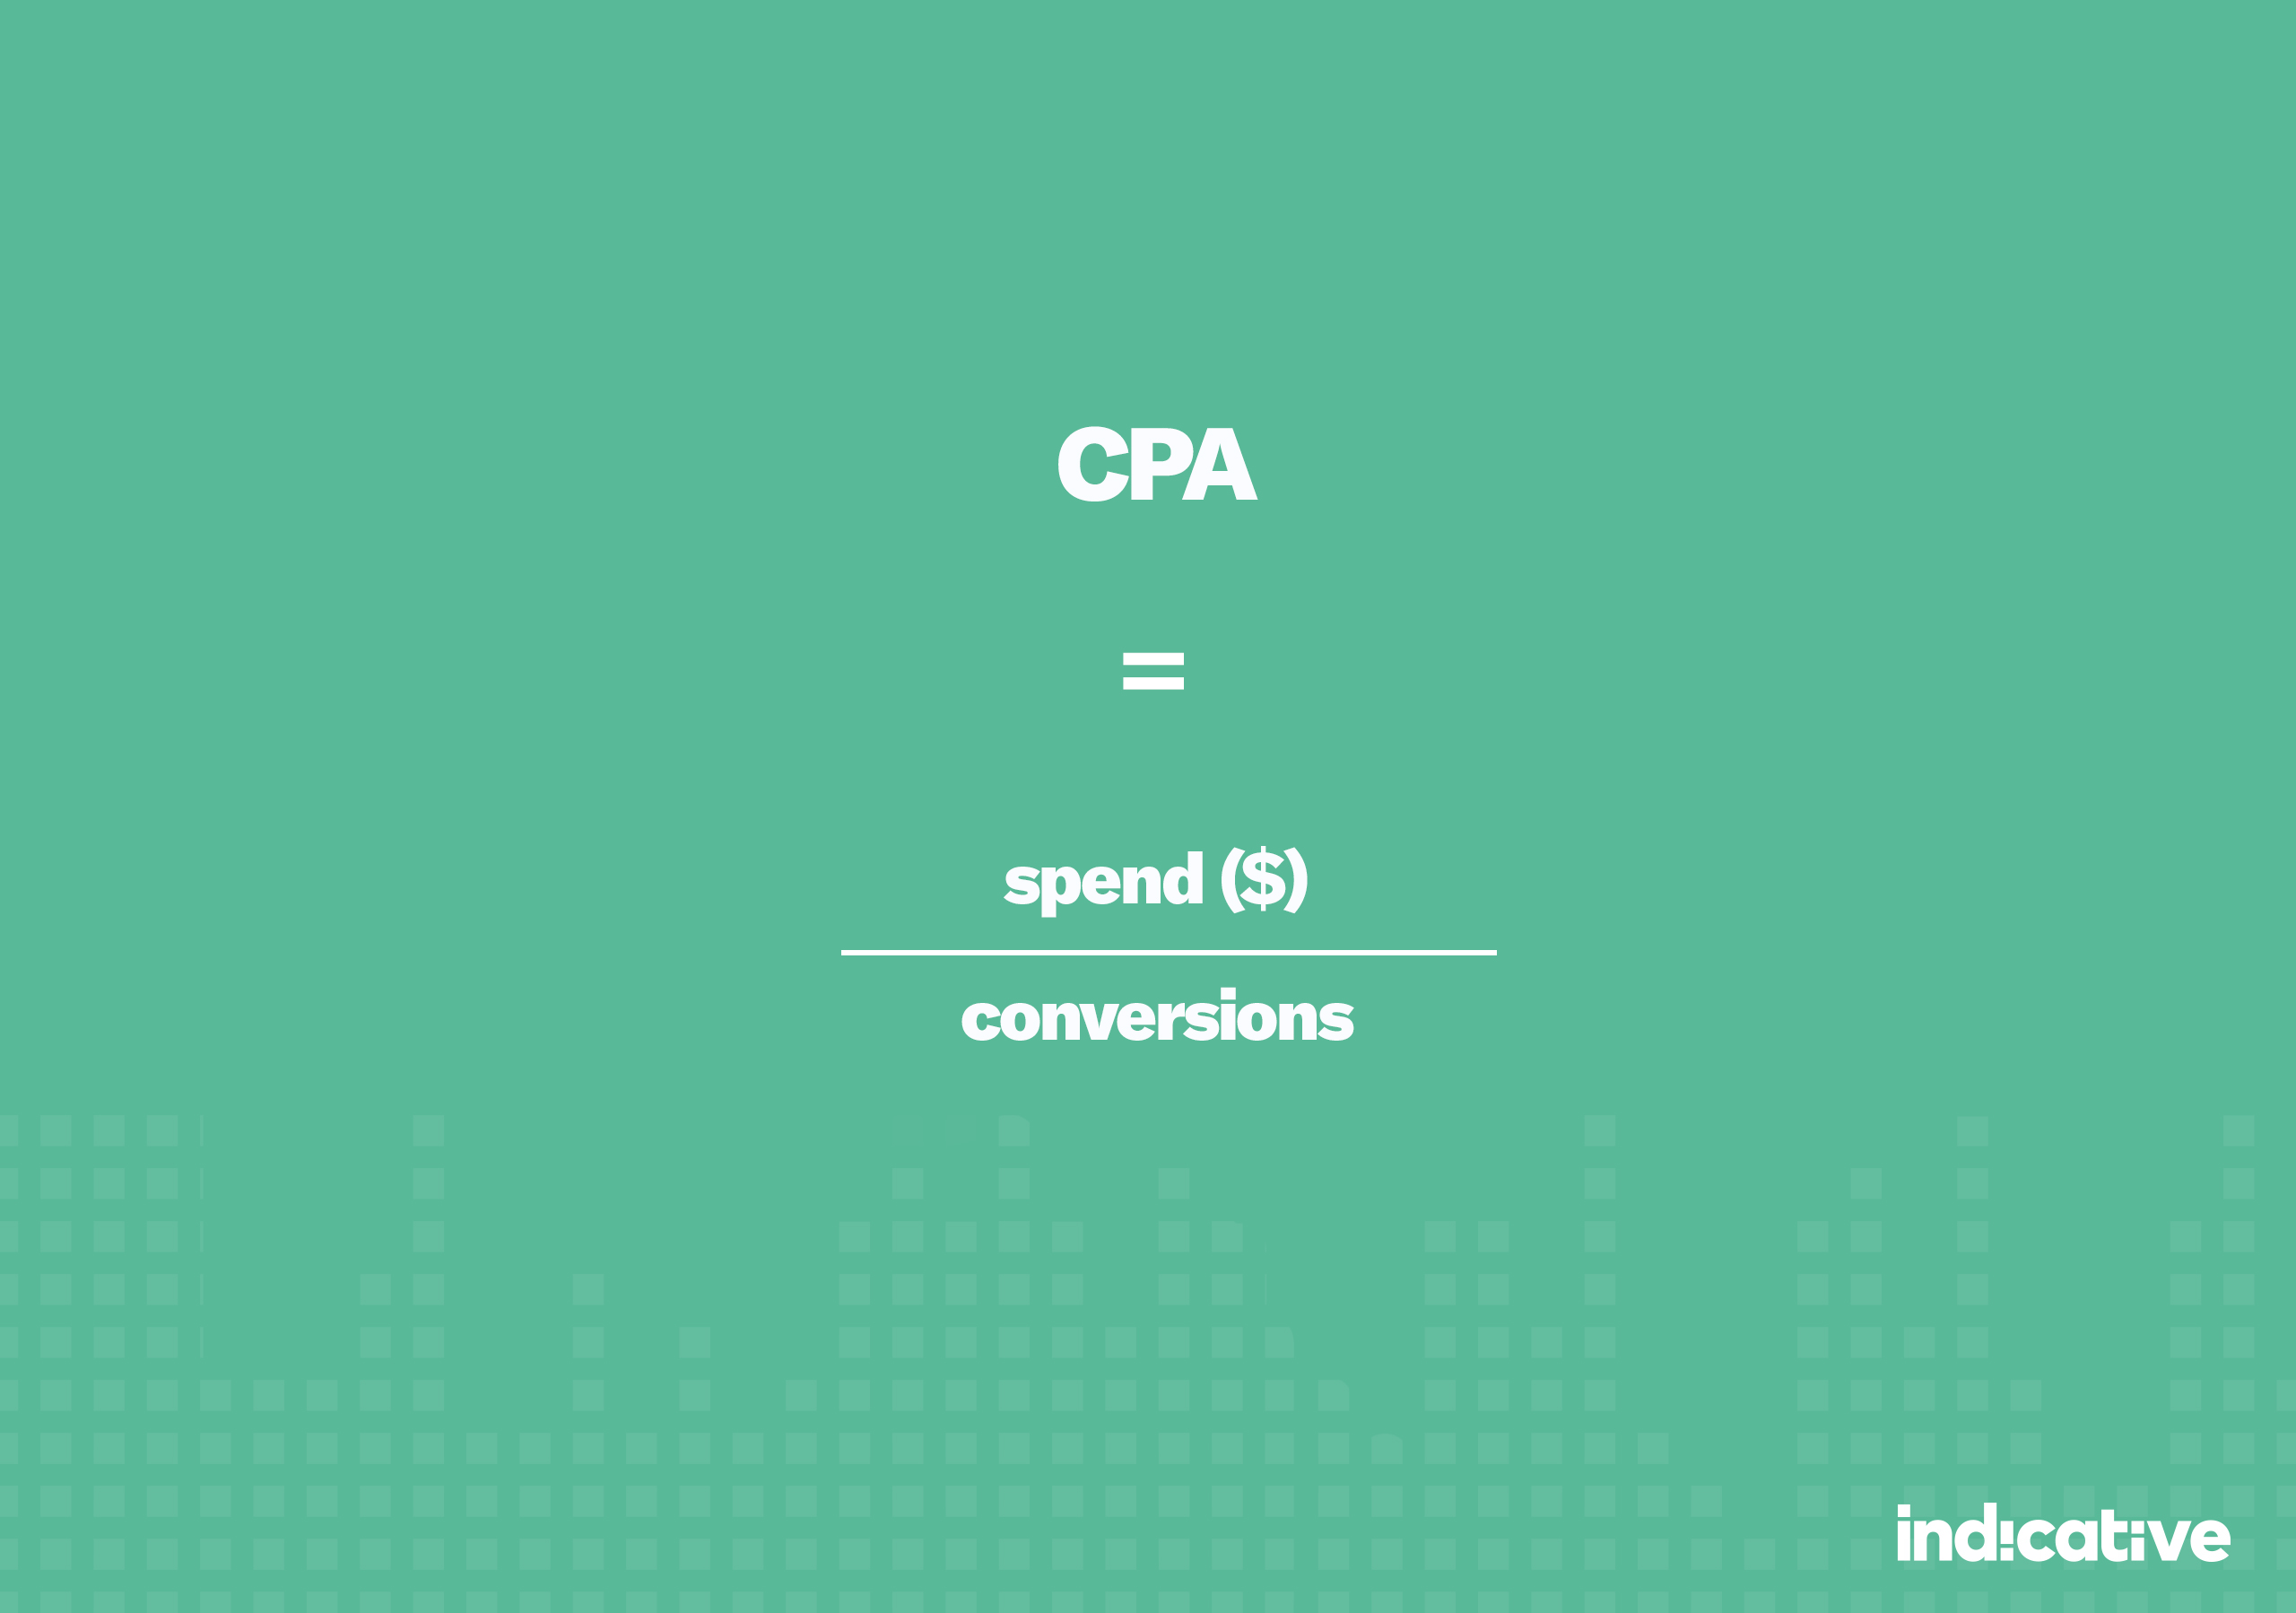
Cost Per Acquisition (CPA)
Cost Per Acquisition measures the cost to acquire one customer. By tracking CPA, you can optimize your budget by knowing where your spending should be focused on.
This is an important metric to track because it better contextualizes the true impact of marketing campaigns according to its overall cost.
Cost Per Acquisition (CPA) Formula
Customer Retention
Customer Retention measures the number of customers who engage with your product and continue to for a prolonged period of time. Also known as repeat customers, they are crucial to a successful business because they can increase customer lifetime value.
This is an important metric to track because retaining customers can often be less costly than investing in efforts to acquire new ones. By establishing long lasting customer relations, you can ensure consistent and predictable engagement in the future.
Marketing Return on Investment (MROI)
It is important to understand your marketing campaigns’ performance and impact by measuring Marketing Return on Investment compared to its cost. With MROI, identify which marketing campaigns benefit your business and which put your success at stake.
A crucial KPI to a successful marketing strategy, MROI helps you understand whether your spending on marketing efforts is justified. Tracking this metric will allow your marketing team to optimize strategies that stimulate conversion and replace those that lead to drop-offs.
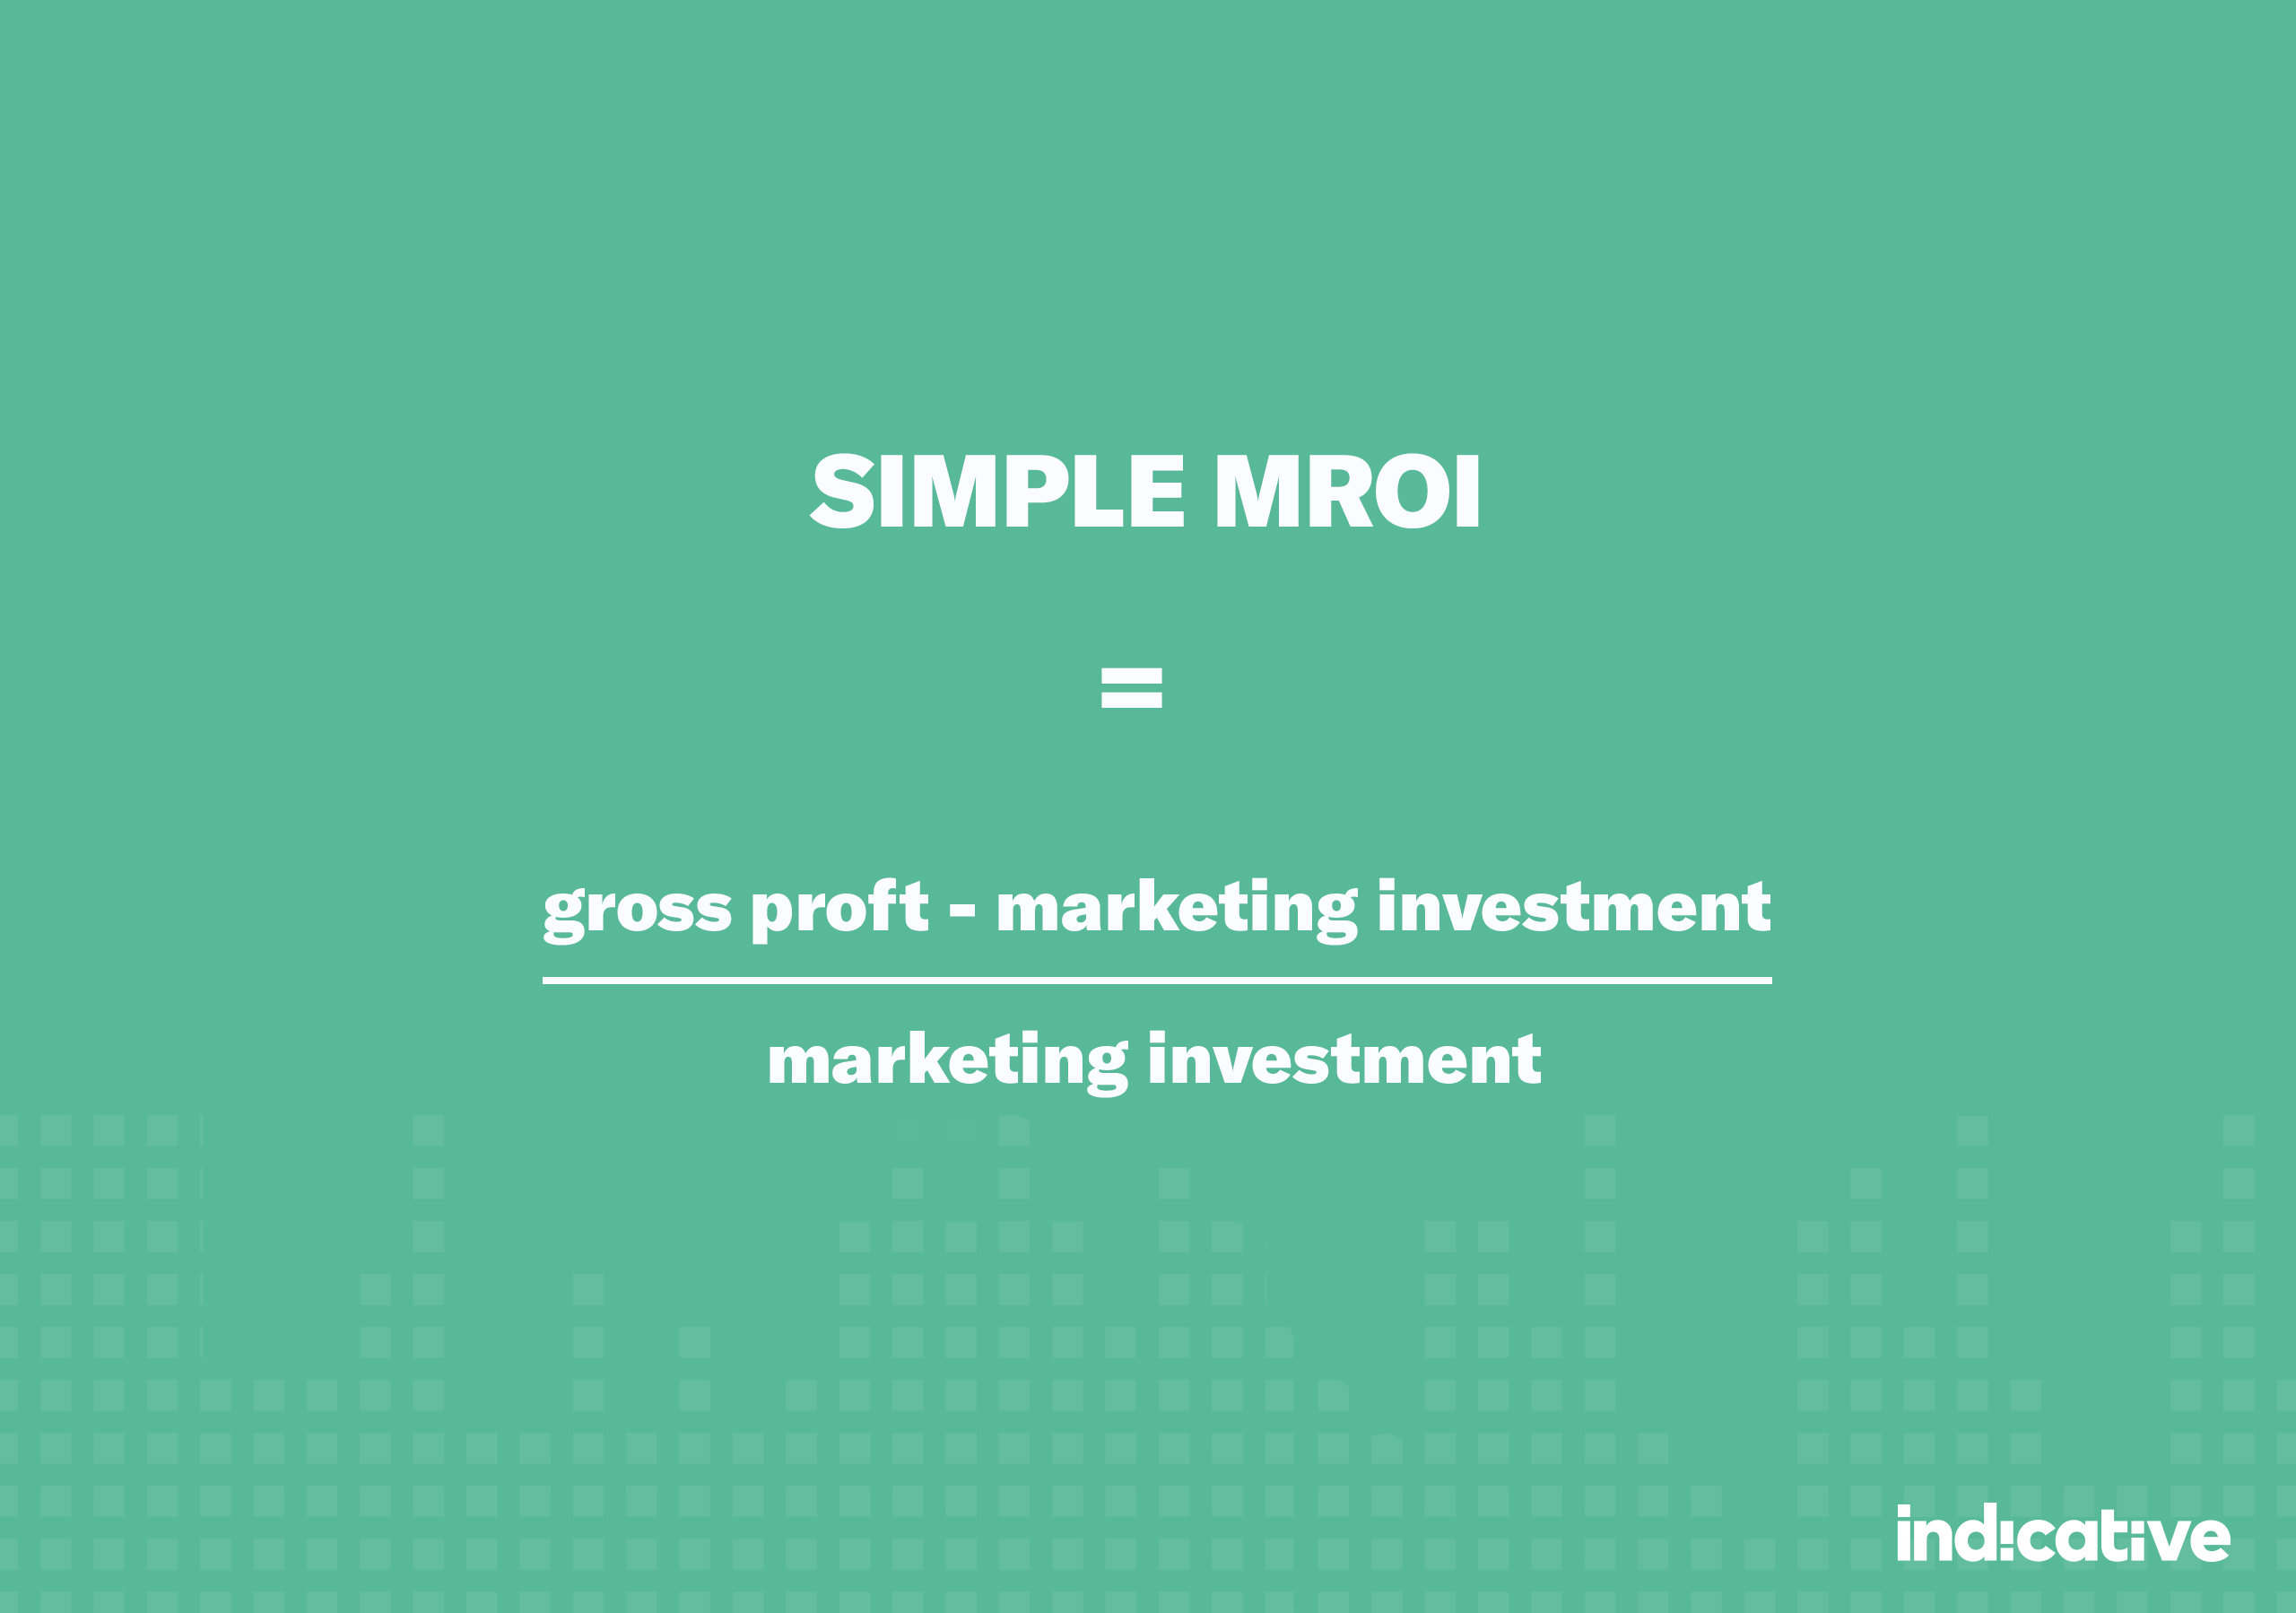
Marketing Return on Investment (MROI) Formula
Referral Traffic
Referral Traffic measures the amount of traffic directed to your product from an outside source. By visualizing the scope of your brand awareness, you can gain insights into how people are informed of your product through social media and organic search.
This is an important metric to track because it will show you how your product is represented to others and whether you should optimize its presence on various social media platforms as well as its ranking in search engines.
Cost per Lead (CPL)
Cost per lead measures the value it will cost to bring in a new lead according to specific campaigns and channels. By understanding cost per lead you can set goals according to a realistic budget.
With a CPL, you can identify the cost-effectiveness of marketing efforts and gain a better understanding of what your business can achieve. Tracking your CPL can have positive impacts on your business by helping you replace inefficient campaigns with better performing ones to drive growth.
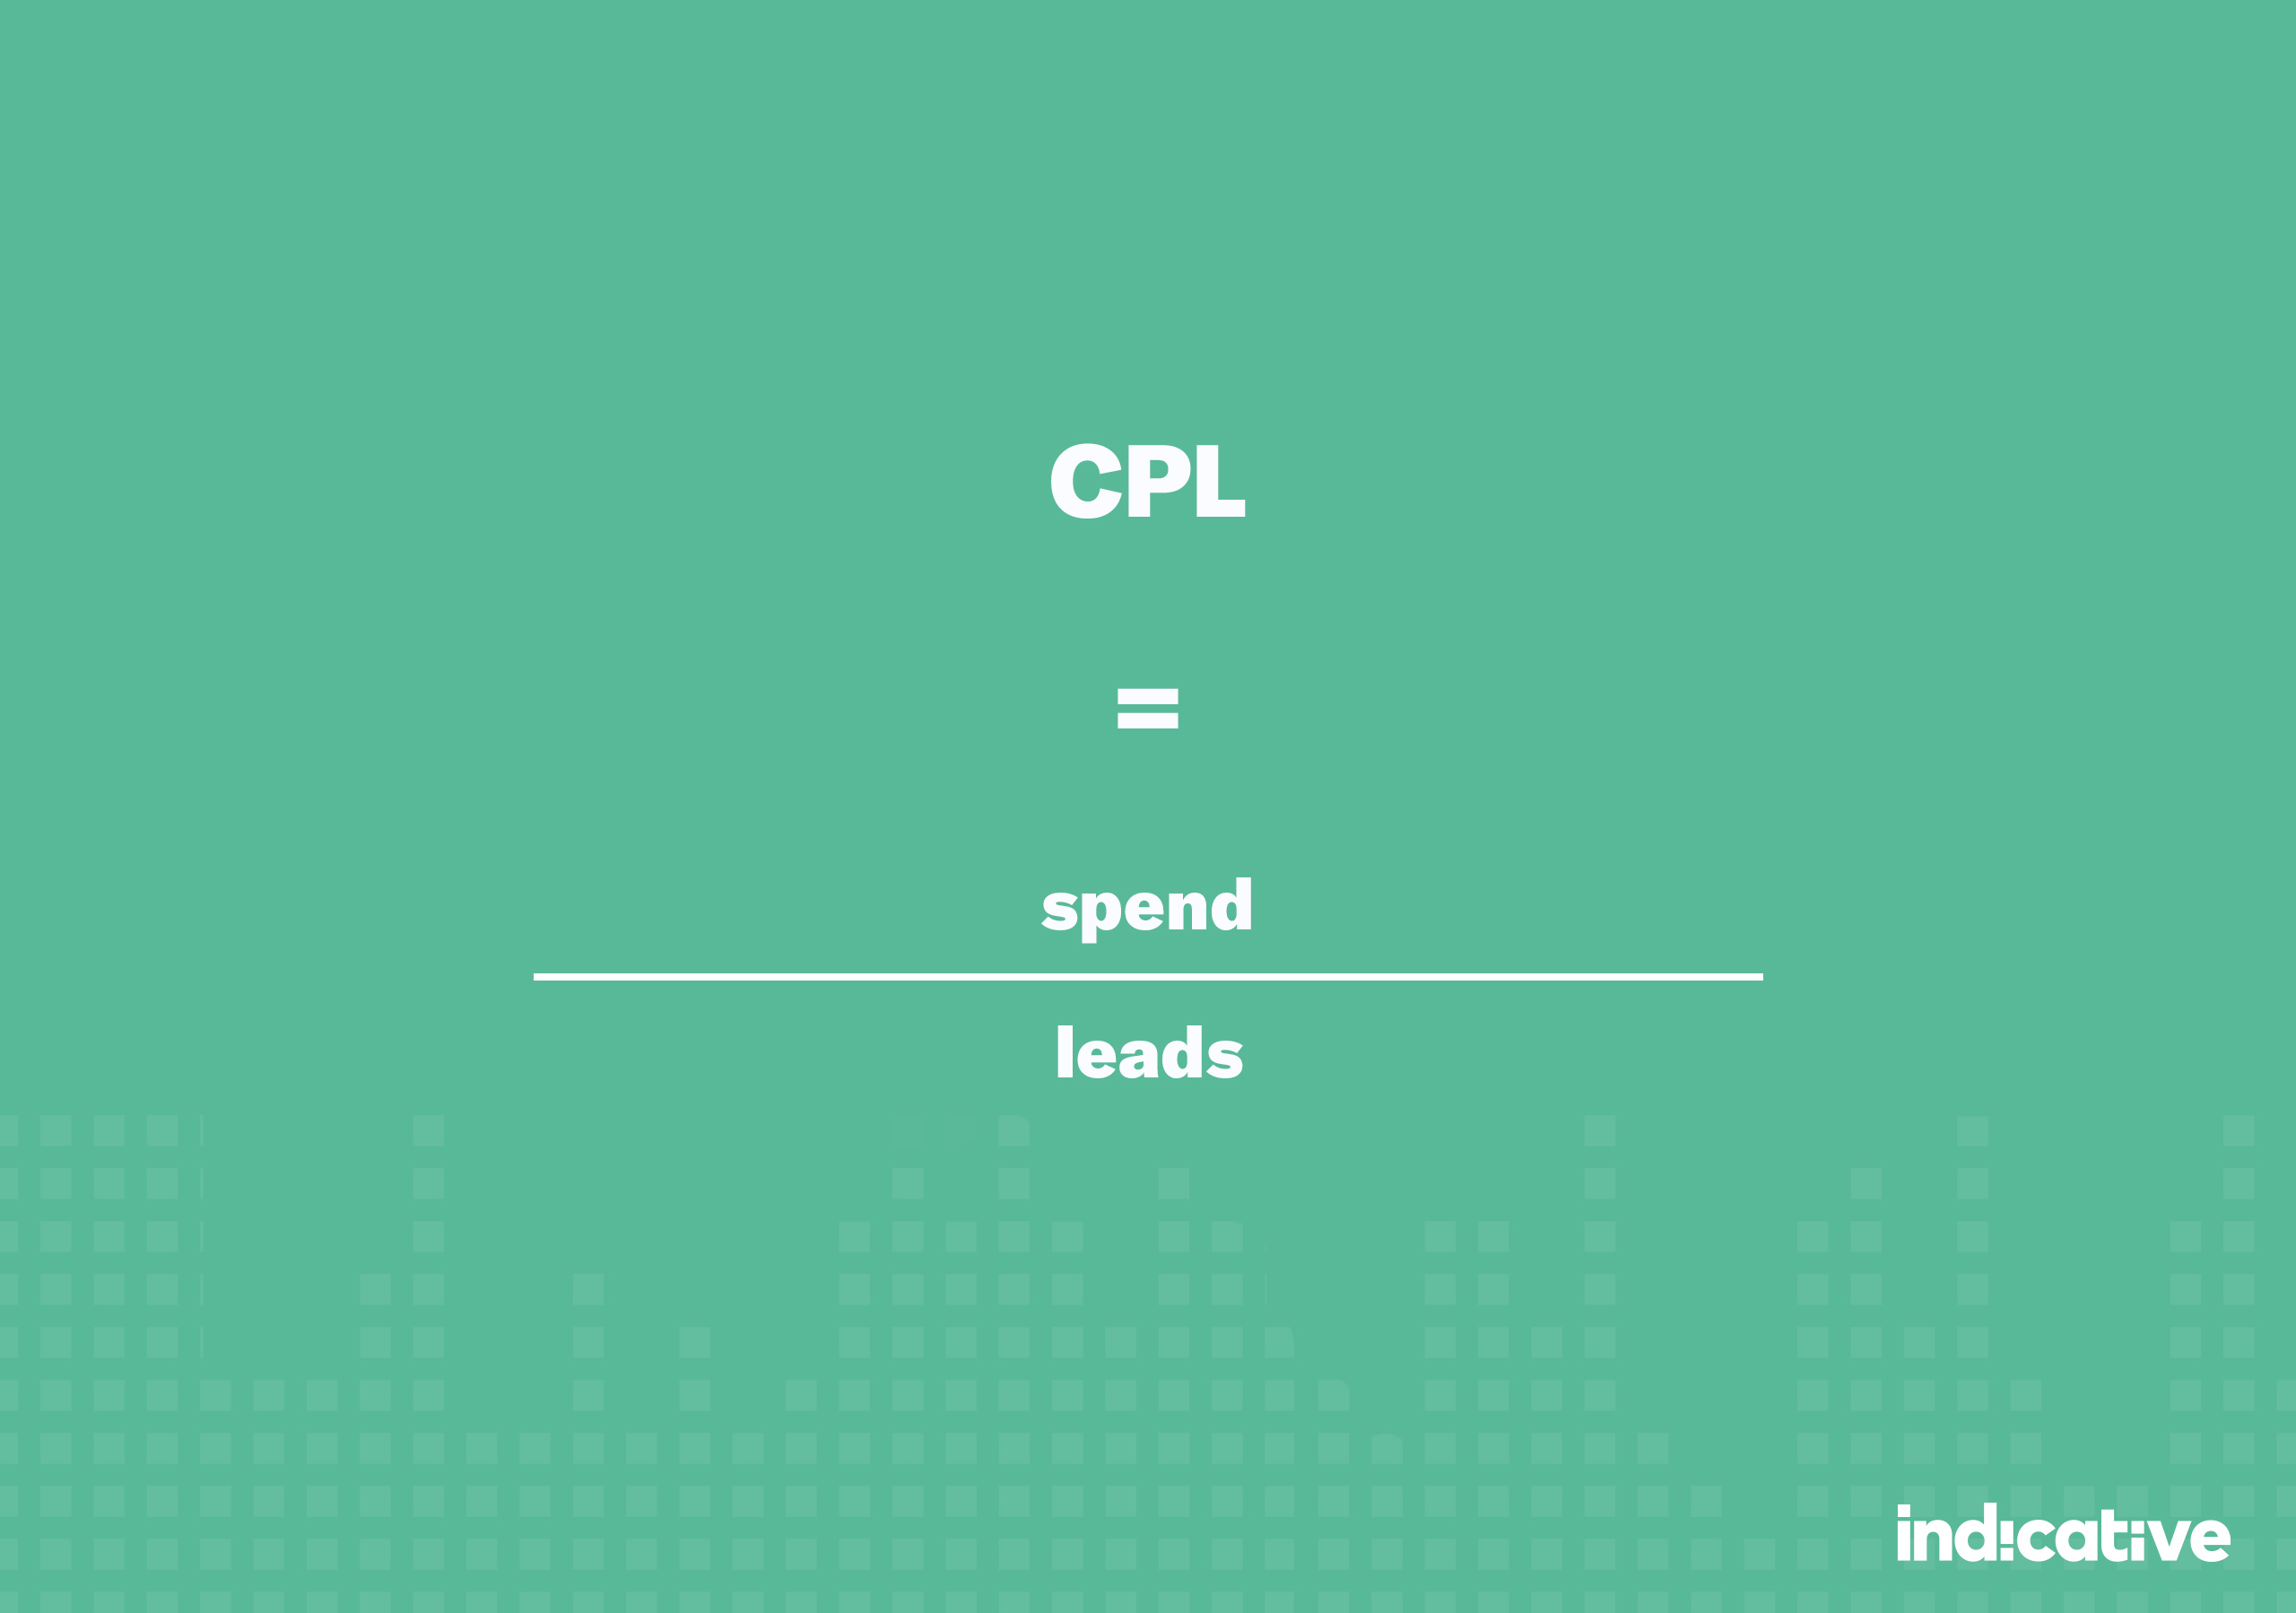
Cost per Lead (CPL) Formula
Tracking These Metrics
As a marketer, these are the 15 marketing metrics to track, but you might be wondering where to start… Going through Google Analytics, each ad platform, and all of the other platforms you use to find the metrics you need can seem overwhelming and tedious.
The analytics space is rapidly growing and the number of tools and products that can help produce actionable insights and identify KPIs is endless. An easy-to-use customer analytics interface that was built with marketers in mind is Indicative. You’ll have access to all of the analysis tools that you need to understand and optimize your customer conversion, engagement, and retention.
Indicative connects all of your user actions and data to create a complete view of your customer and their journey.
Tracking every metric can be overwhelming and counterproductive, which is why it’s important to identify which of those metrics is significant in growing your business and marketing strategy.
Comprehending each of these marketing metrics and how they affect your business allows you to better evaluate and understand your customers’ actions in order to make smarter, data-driven decisions and drive revenue.

 Indicative Team

