
Indicative offers a comprehensive set of analysis tools to help you make data-driven decisions to convert, engage, and retain more users. In the past few weeks, we’ve introduced multiple product enhancements that will give you even more granular insight into your analysis, so that you can get the answers to the questions you’re asking faster.
Conversion over Time Analysis UX Enhancement
Funnels is one of our most popular analytics tools. With Funnels, you can toggle between two different analysis options:
- Conversion tracks users through a multistep sequence of events, or “funnel”. Users who complete steps within the funnel are counted only once.
- Conversion Over Time displays how the funnel performs on a historical basis. Users who complete steps within a funnel can be counted more than once if they complete the funnel over multiple intervals.
In order to help you better understand what your users are doing, we’ve made a number of UX enhancements to our Conversion over Time Analysis.
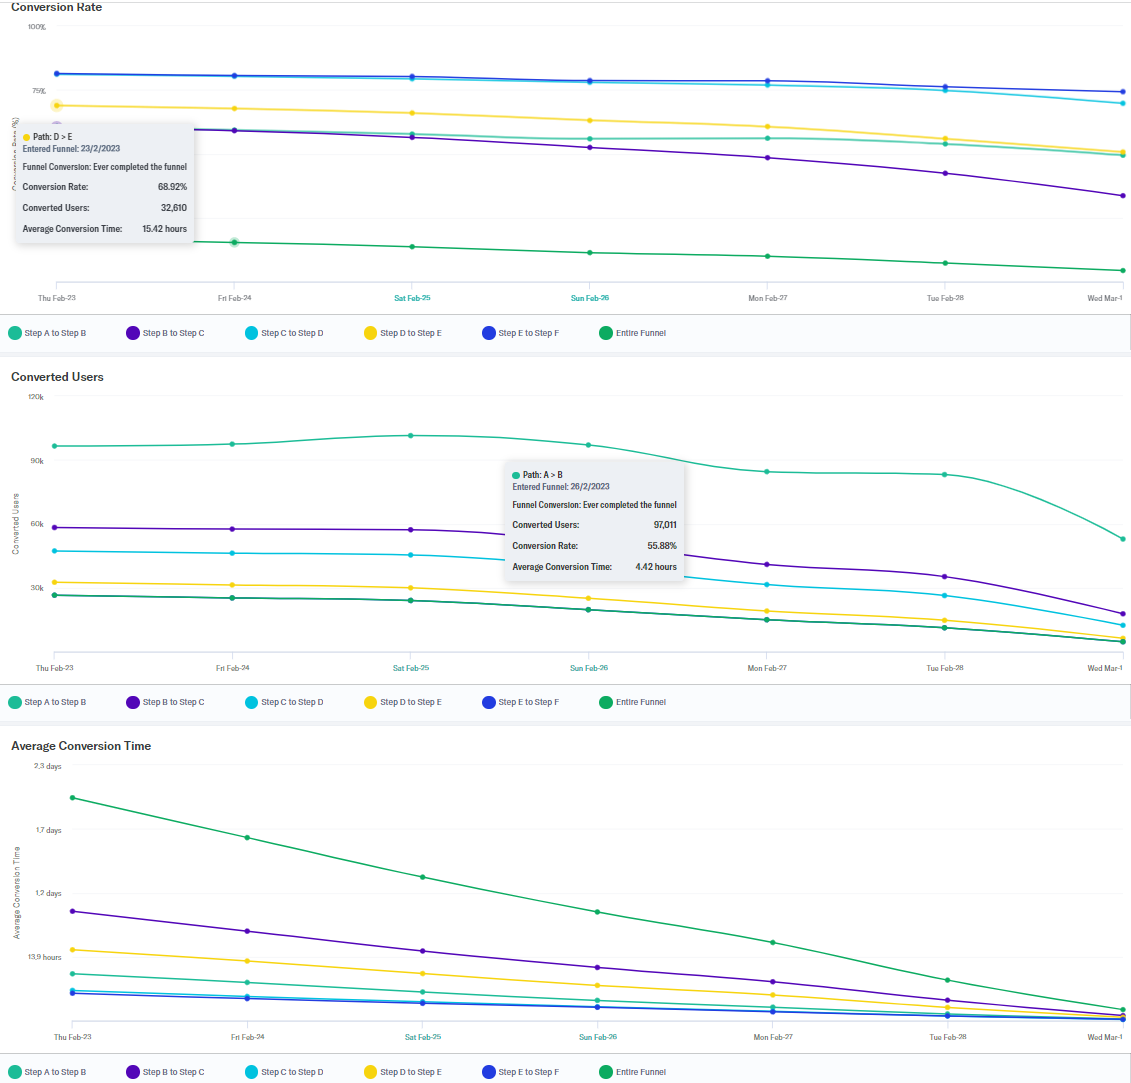
Individual conversion metric visualization
When you run a Conversion over Time analysis, you can now view the analysis as 3 separate graphs: Conversion Rate, Converted Users, and Average Conversion Time. (Previously, all three of these metrics were displayed on a single graph)
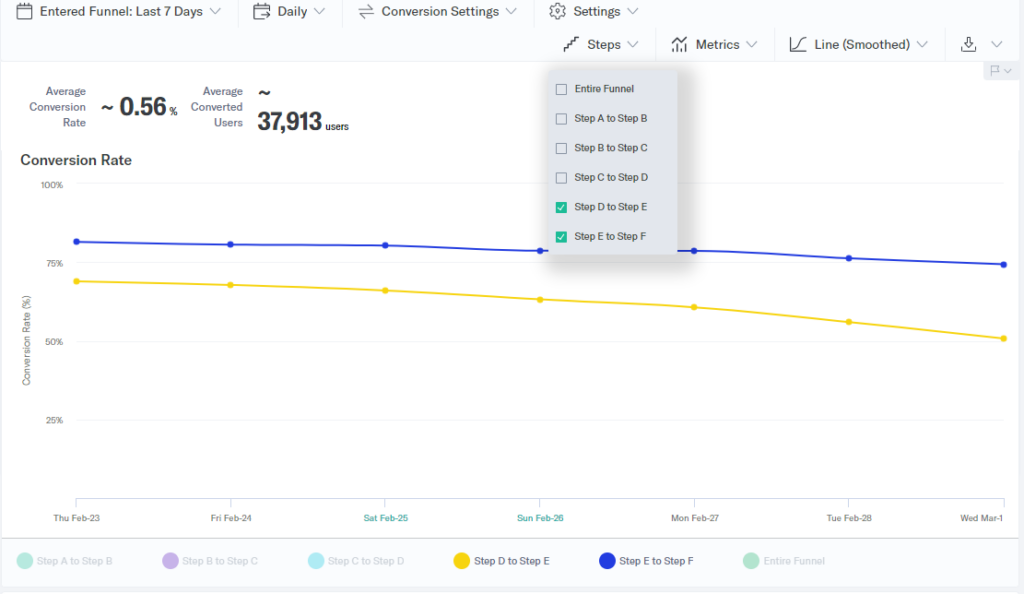
Filter by funnel steps
Your biggest funnel optimization opportunity is not always from step A to B. It could be between step D to E, or step J to K. Now you can analyze how a campaign or feature impacts conversion rates between each step in your funnel.
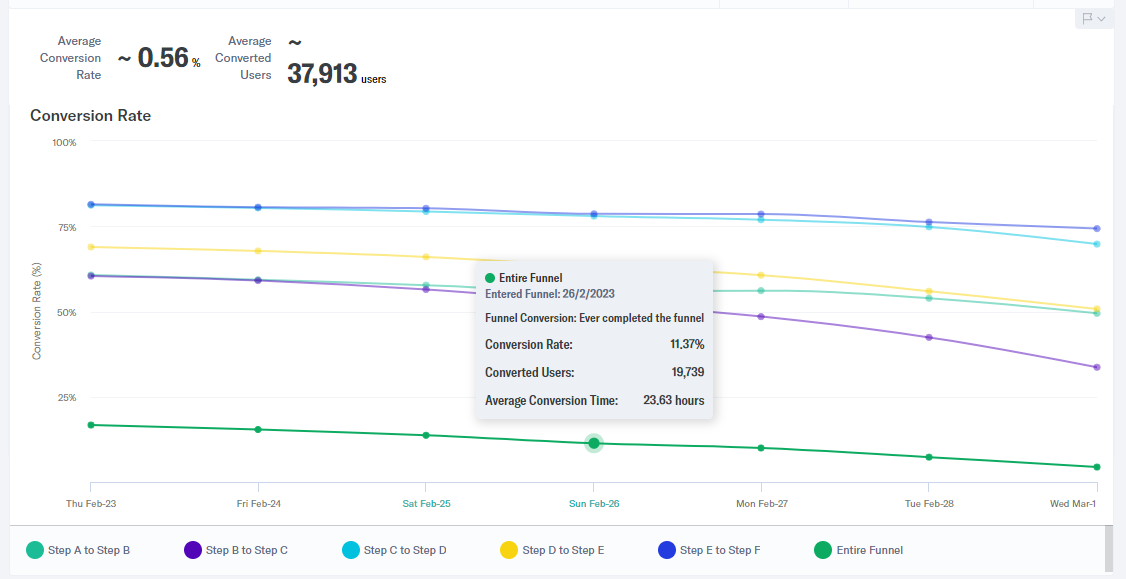
Time-series visualization for multi-step funnels
It’s now possible to analyze the performance over time between different steps in the funnel.
Enhanced mParticle Integration
We’ve also made a number of improvements to our mParticle integration. These enhancements make it easier to accurately capture the full set of data points for analysis.
Support for ingesting event properties sent as arrays
Indicative now supports ingesting mParticle events that are sent as a list using arrays. Ingested mParticle events are parsed and then saved to Indicative event properties as comma-separated values.
For example, if mParticle sends these values for a list of products:
"ProductList": {
     "Name": "Round Brilliant stud earrings with 2 carats* of diamond simulants in 10 carat white gold",
     "TotalAmount": 550,
     "Attributes": {
          "color", "red",
          "size", "M",
          "Metal Colour", "Platinum" }
  {
    "Name": "Hoop earrings with 2 carats* of diamond simulants in 10 carat white gold",
    "TotalAmount": 349,
    "Attributes": {
    "color", "blue",
    "size", "M",
    "Metal Colour", "White Gold",}
Indicative will aggregate the list of attributes as follows:
"Attributes":{
    "color": "red", "blue"
    "size": "M",
    "Metal Colour": "Platinum, White Gold"}
Parse UTM parameters from the InstallReferrer event property
Users can run analyses on event properties for the InstallReferrer event. Previously, UTM parameters was passed as a string; we’ve parsed all the parameters such that users can run analyses on these event properties:
- Source
- Medium
- Term
- Campaign
- Content
Ingest event properties: device type, platform, browser name, browser version, OS name, OS version
These data points captured by mParticle are now forwarded to Indicative. You can now create filters and perform analyses on these event properties, such as “tell me the conversion rates by each device type.”
What’s New with mParticle
Warehouse Sync
For many organizations, the cloud data warehouse is the trusted source of truth for customer data. Indicative was the first product analytics company to offer funnel charts, journey analysis, and other types of visualization on top of warehouse data. With native integrations to Snowflake, BigQuery, and RedShift, teams can easily import their data to get started quickly with analysis and exploration.
We are pleased to announce mParticle Warehouse Sync, enabling data teams to unify their warehouse profile data with their mParticle data into a 360° customer view. With Warehouse Sync, you can easily activate user data and insights such as their propensity to convert, risk to churn, and more from your data warehouse to any number of mParticle’s 300+ integrations.
To learn more, visit the Warehouse Sync product page.
What’s Next
We’ve already made a number of improvements to our mParticle integration, but we’re not done yet! Stay tuned for an exciting announcement (hint: it’s about exporting user lists from Indicative Segmentation analysis and activating them through mParticle Audiences).


