
We’ve launched some features that we think you’ll love! Take a look at our end-of-July updates and announcements:
- Shareable Dashboard Links
- Indicative and Google Analytics
- Data at a Glance
At Indicative, we value our customers’ feedback. Thanks to customer feedback we have a lot of exciting features in the pipeline, that’s why we’d love if you shared your feedback (good or bad) here through our two-question survey!
New Features
Shareable Dashboard Links
 Your dashboards can now be shared with people who are outside of your Indicative network. Sharing your analysis and reporting with execs and partners just got easier! Get started by creating a link in the dashboard settings panel. Learn how!
Indicative and Google Analytics
Our new GA integration allows you to send your complete data set to Indicative for a deeper analysis of your customer journey. With two lines of code, you can gain better insight into your users with Indicative. See how!
Data at a Glance
 Data labels on your saved queries make it easier to gain actionable insights at a glance. With this new feature, when you open up a dashboard, you will be able to save time by instantly seeing your data and previewing the trends in your analysis. Try it out!
Workflow Improvement
 Our analysis tools now allow you to easily filter your analysis by a breakout selection. This allows you to dig deeper into your analysis and streamline your workflow. Check it out!
Duplicate Dashboards
 Duplicating your dashboard allows you to copy over important widgets without having to recreate them, saving you time! Take a look!
Breakouts at a Glance
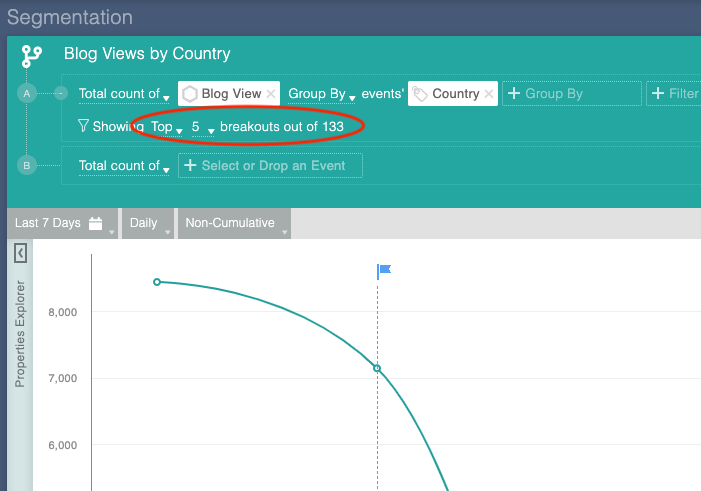
The total number of breakouts is now visible so that you don’t have to dig into your analysis. Take a look!
Product Enhancements:
- You can now hide query row names in chart labels. Click the eye icon in a query row with a “group by” to view breakout values in the chart.
- We’ve changed “all steps” to “first step” to more accurately describe your query entry Date in Funnel.
- Your dashboard default layout mode will be Autoflow, so when widgets are moved to a new space they will automatically reformat themselves without you manually creating the proper amount of space for them.
- Segmentation legend heights have been optimized to self-adjust for you to view them more easily.

 Indicative Team

