
We’ve launched some features that we think you’ll love! Take a look at our April product updates:
- Drop-Down Query Builder
- Analyze & Visualize in New Ways
- Smarter & More Flexible Search
- …and product enhancements!
At Indicative we value our customers’ feedback. We’d love if you shared yours here through our two-question survey.
New Features
Drop-Down Query Builder
We are committed to making analytics as user-friendly as possible, which is why you can now create your analysis directly from the query builder. The new drop-down menu of your events and properties allows you to build your analysis faster and more intuitively. Try it out!
Analyze & Visualize in New Ways
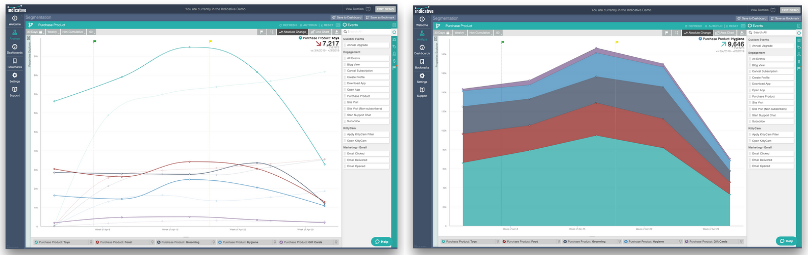
We’ve created two new ways that you can analyze and visualize your data for faster insights in Segmentation. Now, you can see how you’re trending by comparing your current time period to the prior period. Once you run your query, click Trends to quickly analyze your data period over period. You can also view your data as an area chart, allowing you to visualize your data at a glance. Try it out!
Smarter & More Flexible Search
The sidebar search is more powerful than ever before. Instead of having to search individual tabs, you can search across all data types in one place. This, coupled with last month’s release of expanding search to categories and descriptions, makes it easy to find what you’re looking for. Try it out!
User Segments Can Now Be Exported via an API

One of your favorite features, User Segments, is now available via an API so that you can programmatically export segments for use within your own, or third-party, platforms. Learn how!
Track Your WordPress Site with Indicative
With our WordPress plugin, you can easily track page views, link clicks, and web sessions of your site without any code. Learn more!
Visualize a User’s Geographic Location
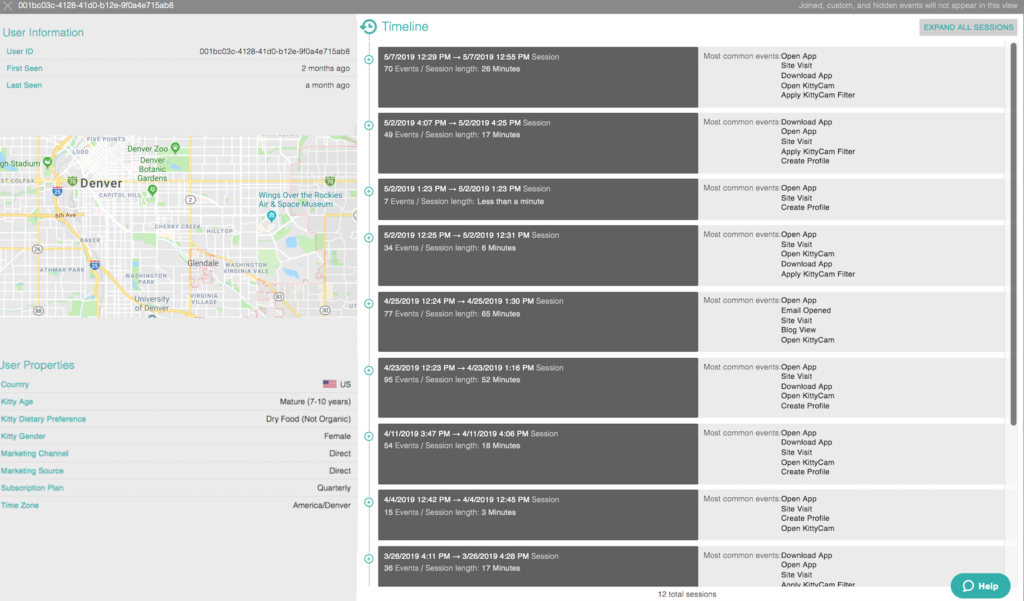 In your users’ profiles, see a map of their location and a flag of their country. We can’t wait to reveal new geo features next month…stay tuned.
Product Enhancements:
✔ Keyboard shortcuts are now available! Simply click CTRL + H to see all of Indicative’s shortcuts. Request shortcuts you’d like to see!
✔ Dashboard widgets show the last time a query was refreshed, making it easy to see how up-tp-date a query is.
✔ Breakouts in Segmentation were improved to show the total count of breakouts and exclude breakouts without values.
✔ Legend height is now saved as part of your query to your dashboard, you don’t have to manually resize it each time. Just edit the size of your legend how you want it to appear before saving it to your dashboard.
✔ In Segmentation, the calculator is now available before you begin building your query to improve your workflow.
✔ ICYMI: Our free plan’s data retention has changes from 12-months to 6-months. Upgrade for unlimited data retention.

 Indicative Team

