
This summer has certainly been eventful. The sporting world has offered us some beautiful moments with the Euros, Copa América, and the Olympics, and the world continues its drive towards vaccination. We’re wishing our customers good health and a happy August. Here at Indicative? We’ve been heads down to create the best product analytics tool for the data warehouse. Check out what’s new:
🔀 Journeys with an Ending Event
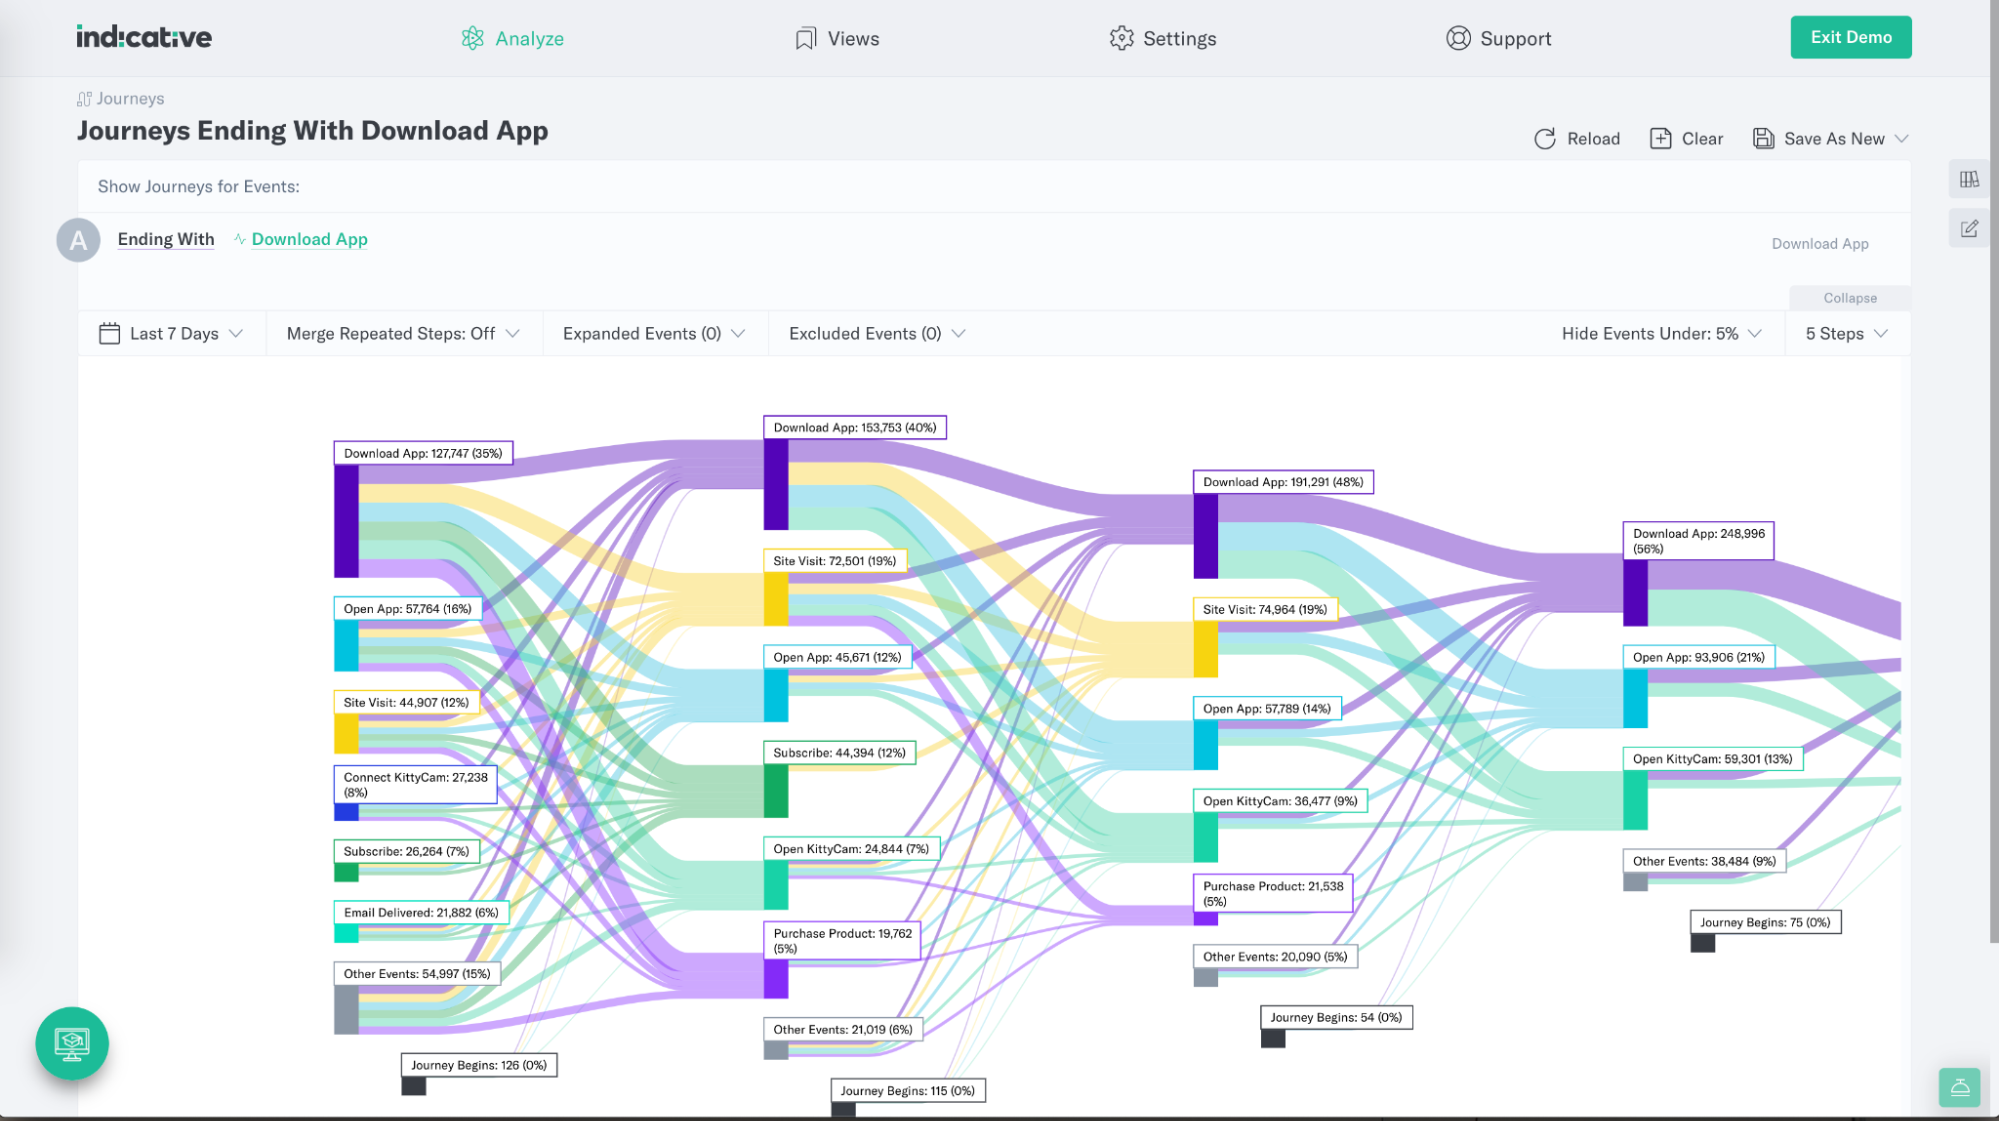
In April, we launched Indicative’s newest tool: Customer Journeys. However, we didn’t stop there. Customer Journeys now supports both Starting Events and Ending Events – track your customer’s exact journeys in both directions, allowing you to understand paths flowing from a starting action, or paths flowing to an ending action! When customers interact with your product, how many steps do they perform before arriving at the target action? Alternatively, how did your customer arrive at a particular target event such as purchasing a product or upgrading a pricing tier? Visualize and optimize your customer pathways up to a chosen point with Journeys: Ending Event. Try it!
🆕 Data Sources
As Indicative continues to grow and expand our data source offerings, our “New Data Source” section needed a makeover.
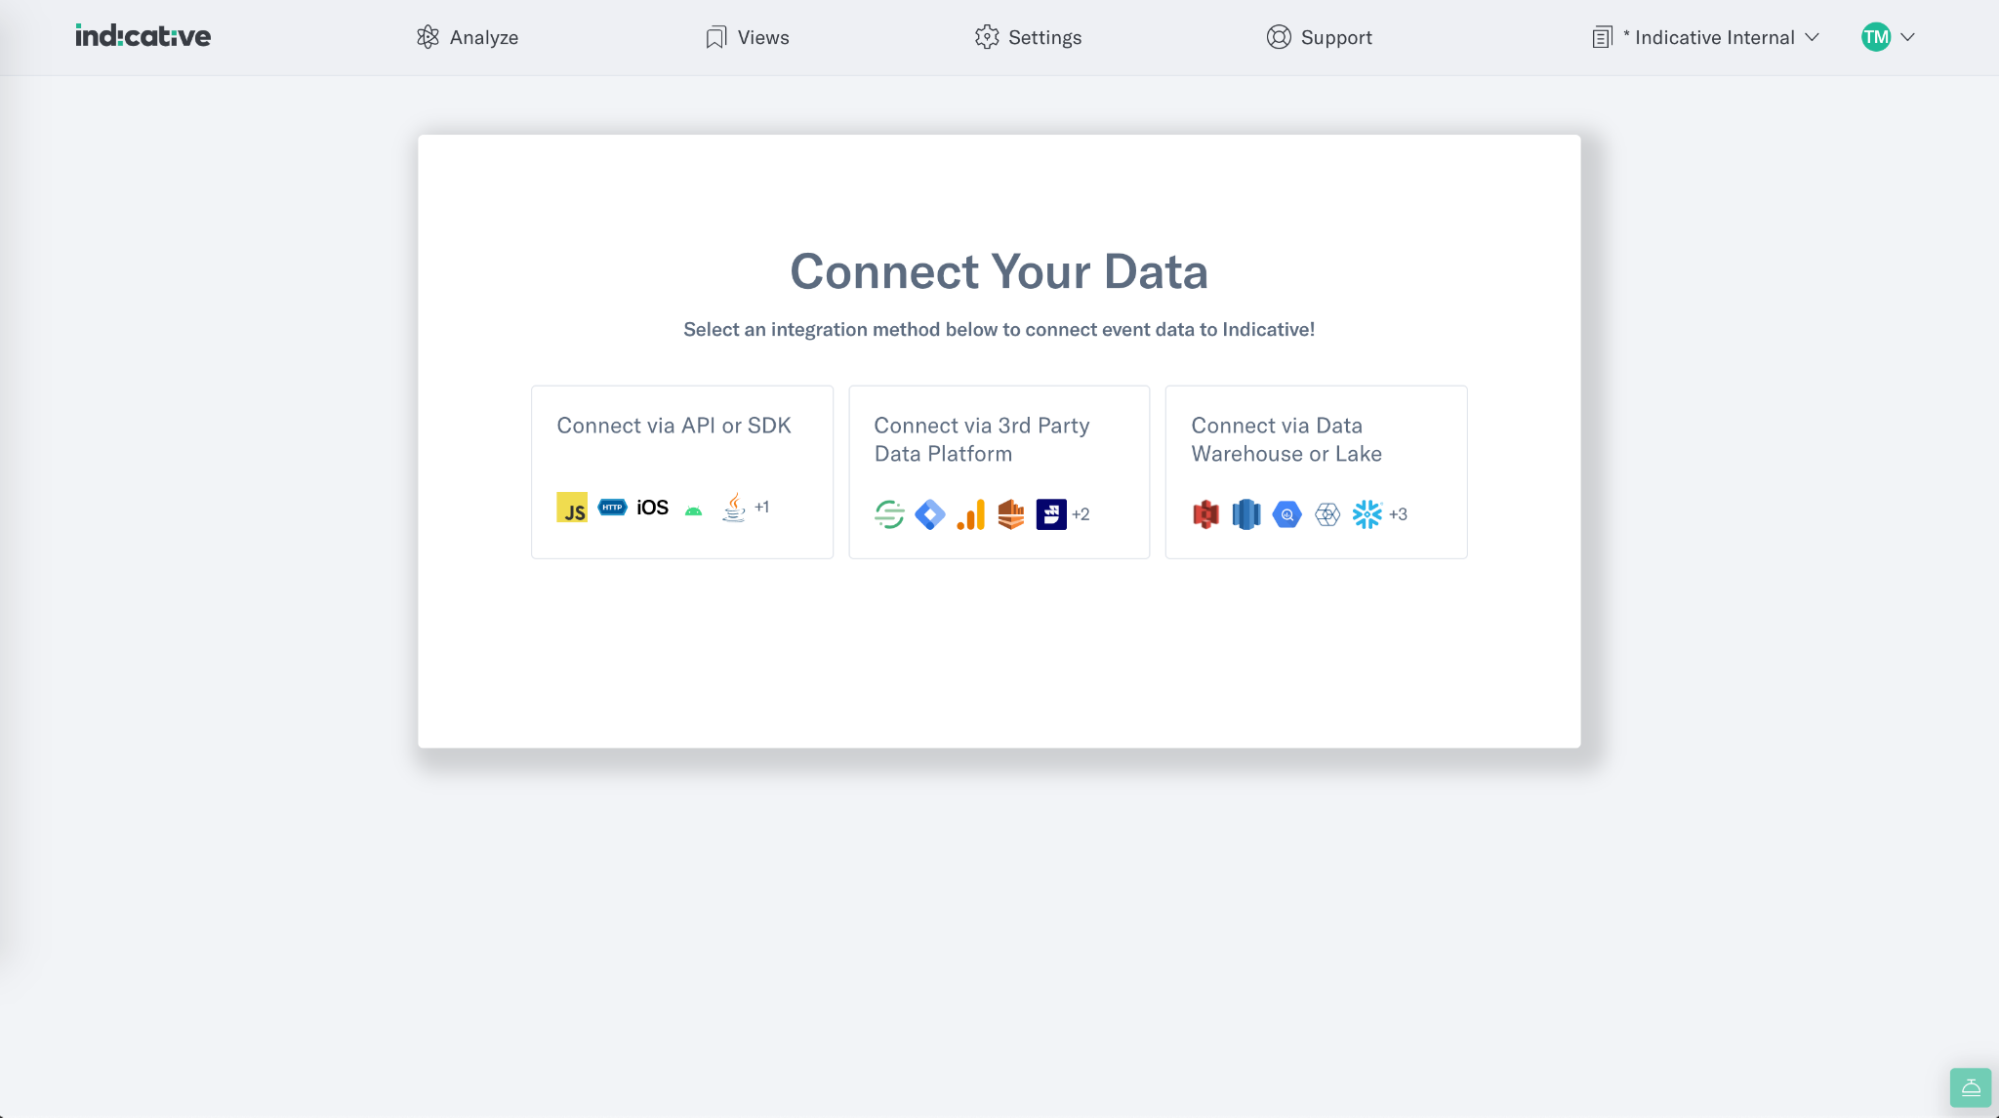
Now you can connect new data sources more easily! Start by selecting your category:
- Via API or SDK
- Via 3rd Party Data Platform such as Segment or Google Tag Manager
- Via Data Warehouse or Lake such as S3 or Big Query
Additionally, we also made the connection process more intuitive by breaking down each step of your experience, and adding a few bells and whistles to make everything look nice. Take a look.
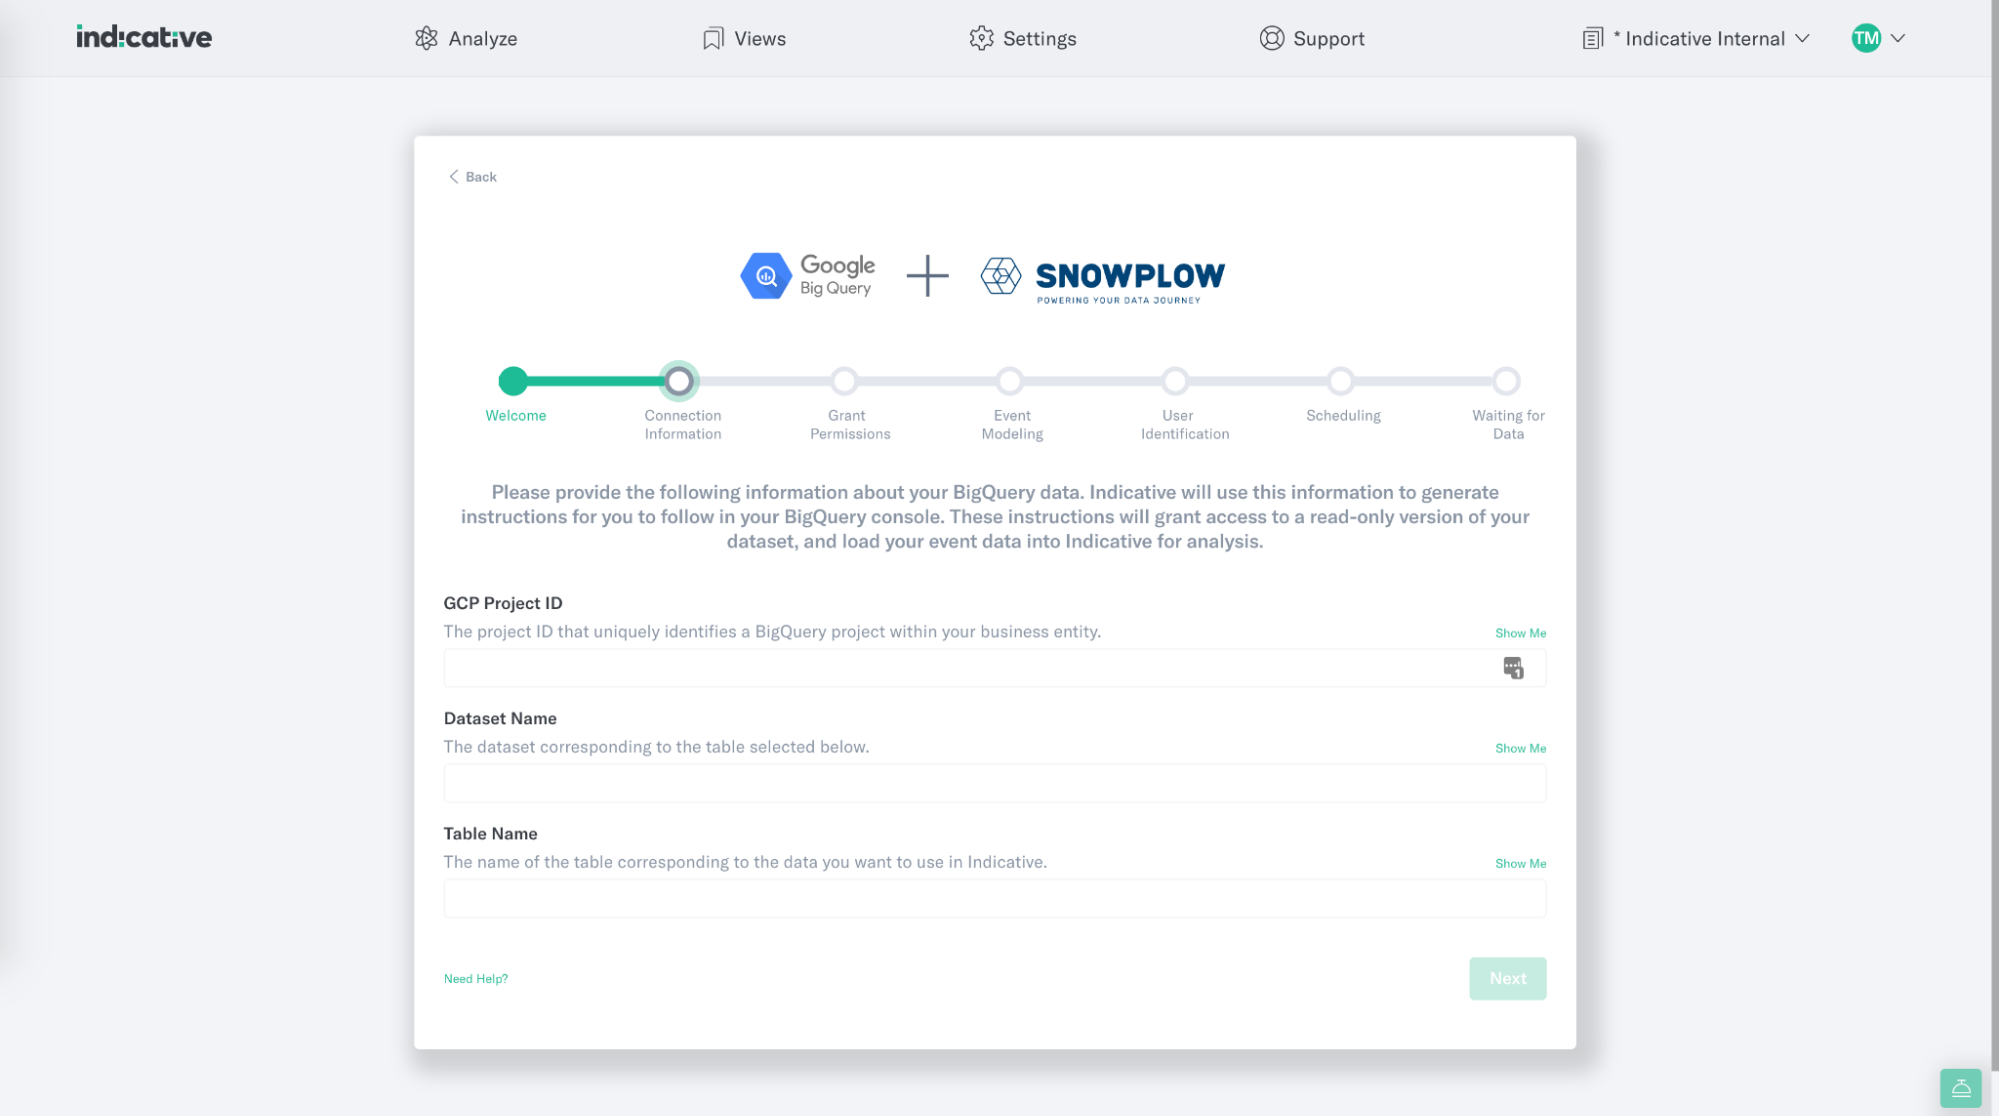
❄ Snowplow Data Source Configuration
Indicative continues to maintain a first class relationship with Snowplow – the leading behavioral data management platform. Indicative supports Snowplow integrations via Snowflake, BigQuery and S3. With this latest addition, new customers can now fully configure their Snowplow event modelling, user identification, and data ingestion scheduling all within the Indicative UI. You can edit existing Snowplow configurations as well! Try integrating!
🔓 Query Usability
First, we introduced a number of usability tweaks to our query builder. When toggling between various filters, Indicative will now maintain the previous filter operator and value. You may also filter by emojis!
Second, when viewing event or property details during query building, the event and property dropdown will remain open in the background.
Query rows may now be deleted by clicking on the corresponding row letter.
Finally, all line charts come in two variations – smooth or straight.
Stay tuned, we have a lot more in the pipeline. Check it out!
✨ Other Improvements
We released smaller bug fixes and improvements, including:
- Dashboard refreshing has been optimized, and wait times drastically reduced.
- We’ve added a bunch of tooltips in our Journeys tool to make the analysis more digestible.
- The tech supporting our Funnel tool has been revamped! Query times are faster!
- Now you can see “Date Last Seen” in your Events & Properties manager.
Try out these exciting new features by exploring our Public Demo or logging into your account today! As you know, we love customer feedback. You can help us improve our tools by sharing your thoughts here.
Thank you and happy analyzing!

 Indicative Team

