
It was a positive, productive, and fast paced year for the Indicative team. We are proud to have released 193 updates that power insights into your customers journey.
As we look towards 2020 releases, here is a quick snapshot of the top features Indicative released in 2019.
Data Integration
Last year we had some exciting partnerships, which allowed for easier and faster data integration capabilities. These integrations included:
Scheduled Reports
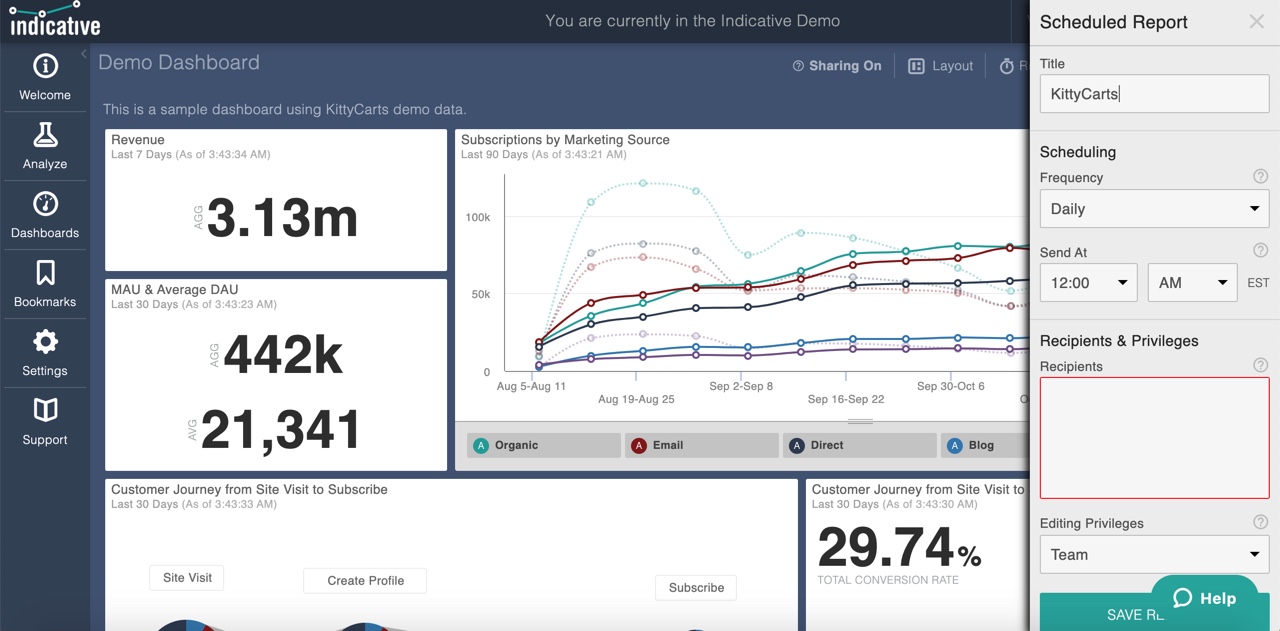
Users can now schedule reports to arrive directly to their inbox. This feature allows users to automatically receive their desired report when they want it, allowing for fast decision making and agile teams. Dashboards can also be shared with external partners via publicly shareable links.
Funnel Analysis
Across 2019, there were several features released that improved Indicative’s funnel analysis.
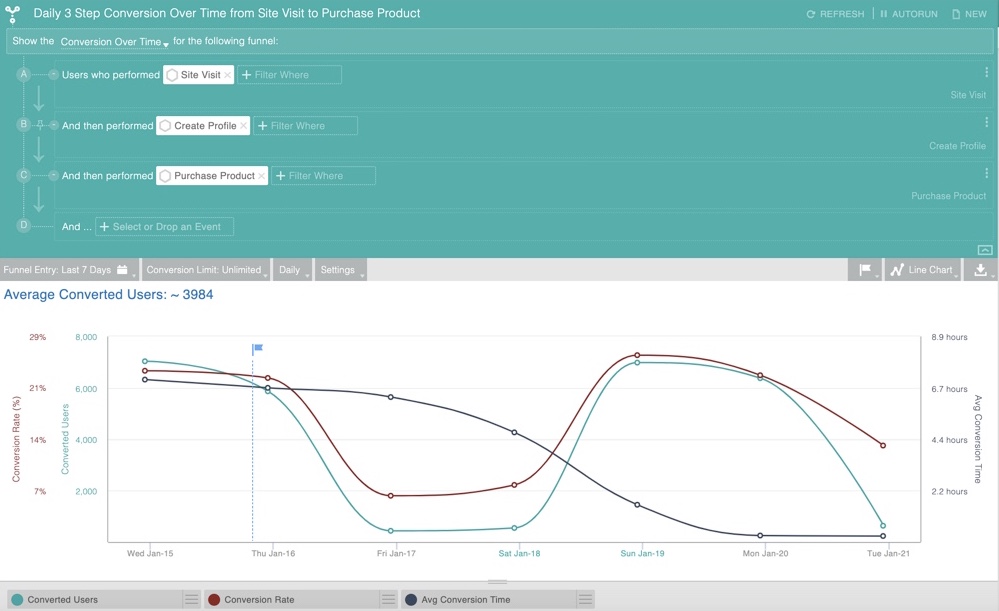
Users can now compare funnel analyses over specific periods of time and set Conversion Limits for how long customers had to complete the entire funnel. In addition, Conversion Over Time enable users to visualize how their customer’s journey changes over time, including conversion rate, average conversion time, and the number of converted users.
Geolocation
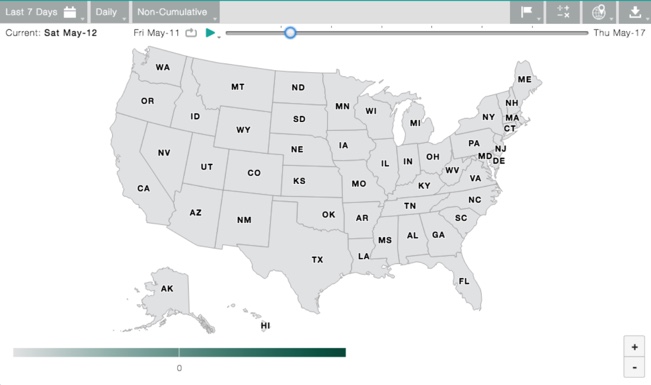
Indicative released geolocation collection capabilities based on IP address. This geolocation release enables users to see their customer’s country, subregion, and city, along with a map of their location. In Segmentation, the maps visualization then enables viewing of user properties based on their geographical region. This is currently available for US states.
User Segments API
The User Segments API enables product managers and marketers to automate their workflow, making the task of optimizing user conversion, engagement, and retention smoother than ever before.
Trends
Trends allows users to understand how they are trending by charts and funnels over time. Trends enables users to view the percent or absolute change over each interval, providing for a more in-depth analysis.
Data Labels
Data labels on saved queries allows users to make actionable insights at a glance. This feature allows users to easily gain insights as it gives users the ability to instantly view their data and preview trends in their analysis.
2019 was an exciting year at Indicative.
2020 will be bigger and better!
The team at Indicative strives to improve your experience, as users, with every new feature released. The ease with which you gain insights into your data will continue to be enhanced in 2020 as we introduce more features.
Keep an eye out for the new releases and please, let us know how we did in 2019. Don’t be shy, tell us what you would like to see, or how we can make your user experience even better. We look forward to your feedback.

 Indicative Team

